The Keil ULINK family of Debug Adapters connect your PC’s USB port to your target system (via JTAG or similar debug interface) and allow you to debug embedded programs running on target hardware.
All ULINK adapters enable you to:
- Download programs to your target hardware
- Examine memory and registers
- Single-step through programs and insert multiple breakpoints
- Run programs in real-time
- Program Flash Memory
- Connect using JTAG or Serial Wire modes
- On-the-fly debug of ARM Cortex-M based devices
- Examine Trace information from ARM Cortex-M3 and Cortex-M4 devices
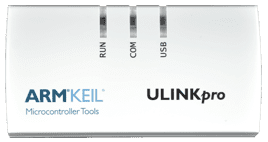
ULINKpro: Debug, serial wire and streaming trace
- Flash programming + run-control
- Memory + breakpoint (access while running)
- Serial wire trace capturing up to 100 Mbit/sec (Manchester mode)
- 50 MHz JTAG/SW clock speed
- ETM trace capturing up to 800 Mbit/sec
- Streaming trace: Instruction trace, code coverage, performance analysis
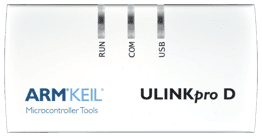
ULINKpro D: Debug and fast serial wire trace
- Flash programming + run-control
- Memory + breakpoint (access while running)
- Serial wire trace capturing up to 100 Mbit/sec (Manchester mode)
- 50 MHz JTAG/SW clock speed
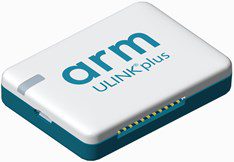
ULINKplus: Debug, serial wire trace, test I/O, and power measurement
- Flash programming + run-control
- Memory + breakpoint (access while running)
- Serial wire trace capturing up to 50 Mbit/sec (UART mode)
- 10 MHz JTAG/SW clock speed
- Power measurement for efficient source code
- I/Os for test automation and continuous integration
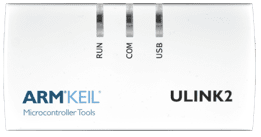
ULINK2: Debug and Serial Wire Trace
- Flash programming + run-control
- Memory + breakpoint (access while running)
- Serial wire trace capturing up to 1 Mbit/sec (UART mode)
- 10 MHz JTAG/SW clock speed
| Feature | ULINKpro | ULINKpro D | ULINKplus | ULINK2 |
|---|---|---|---|---|
| Debugging features | ||||
| RAM breakpoints | Unlimited | Unlimited | Unlimited | Unlimited |
| ROM breakpoints (Arm 7/9) | 2 max | 2 max | 2 max | 2 max |
| ROM breakpoints (Arm Cortex-M) | 6 max | 6 max | 6 max | 6 max |
| Execution breakpoints (Set while executing) |
||||
| Access breakpoints (Arm7/9) | 2 max (R/W only, with value) |
2 max (R/W only, with value) |
2 max (R/W only, with value) |
2 max (R/W only, with value) |
| Debugging support | ||||
| Real-time agent (Arm7/9) | ||||
| Serial wire debug (Arm Cortex-M) | ||||
| Data trace (Arm Cortex-M with SWO) (Serial wire viewer – SWV) |
||||
| Instruction trace (Arm Cortex-M3/4/7/33) (Embedded trace macrocell – ETM) |
||||
| Power measurement | ||||
| Digital/Analog I/Os For test automation |
||||
| Performance | ||||
| JTAG/SW clock | ≤ 50 MHz | ≤ 50 MHz | ≤ 10 MHz | ≤ 10 MHz |
| Memory R/W | ≈ 3 MB/s | ≈ 3 MB/s | ≈ 1 MB/s | ≈ 28 KB/s |
| Flash R/W | 32 KB/s | 32 KB/s | 32 KB/s | ≈ 25 KB/s |
| Trace streaming | 800 Mb/s | 100 Mb/s | 50 Mb/s | 1 Mb/s |
| Connectors | ||||
| 10-pin (0.05″) (Cortex debug connector) |
||||
| 20-pin (0.1″) (Arm standard JTAG connector) |
||||
| 20-pin (0.05″) (Cortex debug + ETM connector) |
||||
| 16-pin (0.1″) (Infineon OCDS connector) |
||||
| 14-pin (0.1″) (ST µPSD connector) |
||||
| I/O voltage range | 1.2 V – 3.3 V | 1.2 V – 3.3 V | 1.2 V – 5.5 V | 2.7 V – 5.5 V |
| Supported device families | ||||
| XC800, µPSD, XC166/XE166/XC2000 | ||||
| LPC950 (8051) | ||||
| Arm7, Arm9 | ||||
| Arm Cortex-A (32-bit) | ||||
| Arm Cortex-M |


