Every embedded engineer knows the bug that won’t sit still. It surfaces once an hour, or once a day, in the field but never on the bench. By the time you’ve attached a debugger and set a breakpoint, the conditions that triggered it are gone. You’re left reading the wreckage after the program has already run off the rails.
This is the problem trace was built to solve, and the reason streaming trace has quietly become one of the most valuable tools an embedded team can put on the bench.
Trace, without the ceiling
Classical trace capture is bounded by whatever buffer sits inside the probe. You get a window, a few seconds, maybe less at high clock rates, and you hope the bug happens to land inside it. For intermittent faults, that’s a coin toss.
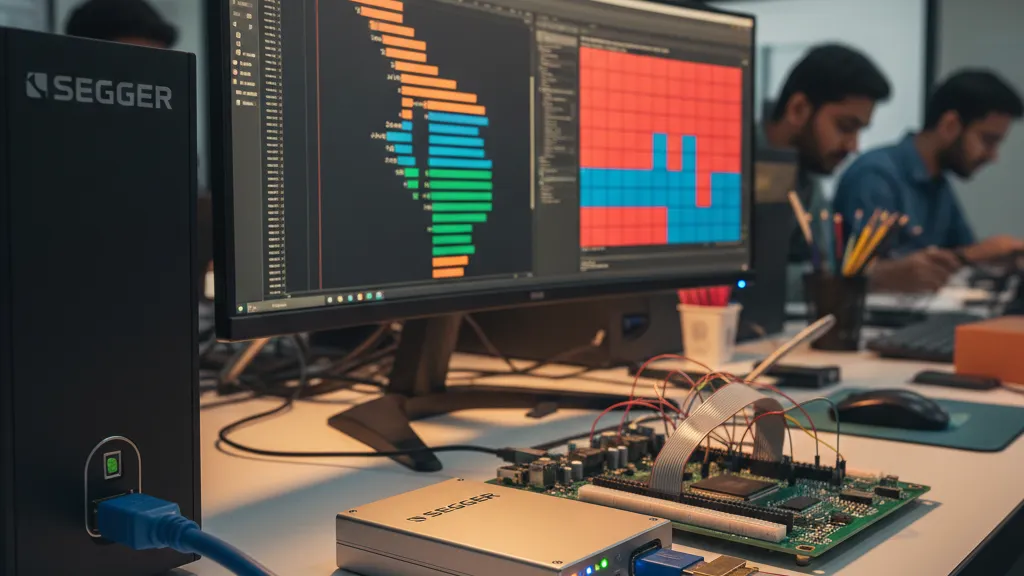
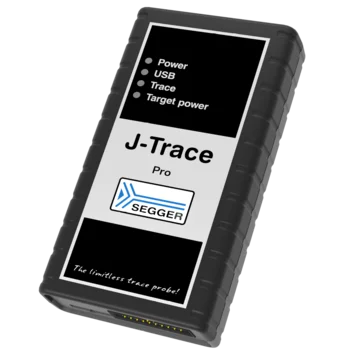
SEGGER’s J-Trace PRO removes the ceiling. Its SuperSpeed USB 3.0 interface streams trace data continuously to the host at the full trace clock, so capture is bounded only by your disk. That means complete instruction traces over effectively unlimited periods, long enough to finally catch the fault that only appears once in a million cycles. A 64 MB on-board buffer absorbs the bursts; the host link does the rest.
The practical effect is a shift in how you work. Trace stops being a special-occasion instrument you reach for when everything else has failed, and becomes something you can simply leave running.
How streaming trace actually works
The path from CPU to disk has four hops, and J-Trace PRO is built so none of them is the bottleneck:
- On-chip trace generation: the Embedded Trace Macrocell (ETM) on Arm cores, or N-Trace BTM on RISC-V, emits compressed instruction trace as the program executes. Nothing is instrumented in your source code.
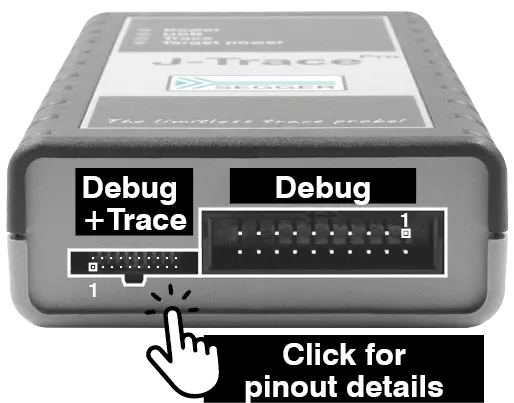
- Trace pin transport: four parallel TRACEDATA lines plus TRACECLK carry the stream off-chip via a 19-pin Cortex Debug + ETM connector, clocked at up to 300 MHz TPIU.
- Probe-side buffering: the J-Trace PRO’s 64 MB on-board buffer absorbs bursts the host link can’t immediately drain.
- USB 3.0 SuperSpeed to host: the probe streams continuously over USB 3.0 to the workstation, where capture is bounded only by disk.
The probe also exposes Ethernet, which matters for shared lab benches and remote target rigs where USB tethering is impractical.
Coverage and profiling that earn their keep
Trace stops being a debug toy the moment your verification flow asks you to prove something, what executed, how often, on which path. Functional-safety and assurance flows under IEC 61508, ISO 26262 and DO-178C all need that evidence, and SEGGER built J-Trace PRO so it lands without bolting in instrumentation that would distort timing.
-
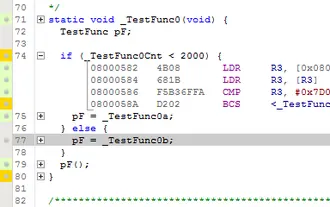
Live code coverage records which source lines, instructions and branches actually executed during a test run. SEGGER’s own example output breaks down to per-function granularity:
Module/Function | Source Lines   | Instructions
BSP_Init        | 9/9 (100%)     | 93/93 (100%)
Total           | 47/52 (90.4%)  | 293/300 (97.7%)
Reports export from Ozone as plain text, so they slot straight into QA and certification dossiers without a custom adapter.
-
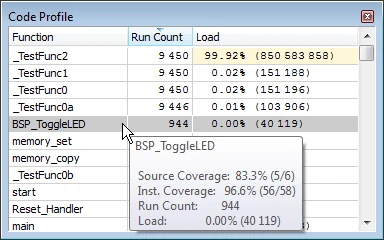
Live code profiling uses ETM for instruction-level fidelity, or DWT PC sampling for a low-cost overview. Hotspots, dead code and unexpected interrupt traffic surface from real execution, and because the sampling hardware lives inside the core, SEGGER’s own line on it stands: “PC sampling facilities are part of the core, they can monitor it without any intrusive effect on its execution.”
Both run continuously while the target runs. The auditor’s question, show me the coverage, gets a direct answer instead of a project.
One probe, the architectures you’ll actually use
Roadmaps move. A team committed to Cortex-M today may be evaluating RISC-V next year, or scaling up to Cortex-A/R for a richer SoC. The J-Trace PRO family spans Cortex-M, Cortex-A/R and RISC-V, so the tooling decision you make now doesn’t quietly become a constraint later. You invest in a workflow, not a dead end.
The J-Trace PRO model matrix
SEGGER ships four variants. Pick the one that matches your roadmap, not your current target, every model carries the same 64 MB on-board trace buffer and the same streaming-trace ceiling.
| Model | Part # | Cores supported |
|---|---|---|
| J-Trace PRO | 8.24.00 | Arm Cortex-M / A / R + RISC-V |
| J-Trace PRO Cortex | 8.20.00 | Arm Cortex-M / A / R |
| J-Trace PRO Cortex-M | 8.18.00 | Arm Cortex-M |
| J-Trace PRO RISC-V | 8.22.00 | RISC-V |
All four models are available in India through GSAS with competitive pricing and short lead times.
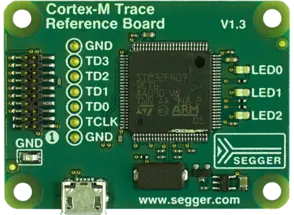
All four ship with USB 3.0 and ribbon cables in the box; the three Cortex-capable models also include SEGGER’s Cortex-M Trace Reference Board, which is what makes a five-minute first-trace session realistic.
The software is the point: and it’s included
A probe is only as good as the environment around it. With J-Trace PRO, that environment ships in the box at no extra cost:
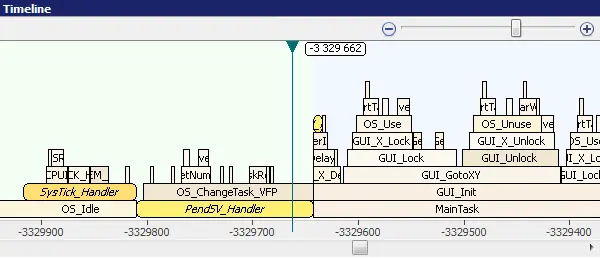
- Ozone: SEGGER’s full-featured graphical debugger, with trace, timeline and live analysis built in.
- J-Flash: production-grade flash programming.
- J-Link debug capability with unlimited flash breakpoints, plus Real-Time Transfer (RTT) for live terminal I/O, and free software updates.
There are no per-seat trace licenses to negotiate and no feature paywall between you and the capability you bought. For a working engineer, that removes a whole category of friction, and for a team scaling up, it removes a whole category of procurement overhead.
How to actually get started
The fastest path to a working trace session is the one SEGGER ships in the box:
- Plug the J-Trace PRO into a host running the latest J-Link software (Windows, macOS or Linux, same binary feature set).
- Connect the supplied Cortex-M Trace Reference Board via the 19-pin trace connector.
- Open Ozone, pick the reference project, hit run.
SEGGER’s own claim, “up and running with your first trace session within 5 minutes”, matches what we see on the bench when teams in India try it for the first time. For custom hardware, the autodetect-first model handles most Cortex-M targets out of the gate; chips that need bespoke trace-pin init use .JLinkScript or .pex files, of which SEGGER ships hundreds of working examples.
Why this matters for Indian engineering teams
India’s automotive, aerospace, defence and industrial programmes are moving up the safety and reliability curve fast. Coverage evidence, deterministic debugging and confidence under fault conditions are no longer differentiators, they’re table stakes. Yet many teams still treat trace as exotic, reserved for the one engineer with the expensive setup.
J-Trace PRO is what changes that calculation. It puts streaming trace, coverage and profiling within reach of the whole team across Bengaluru, Hyderabad, Chennai, Pune, Mumbai, and Delhi NCR, on the cores they’re shipping, with a software stack that doesn’t fight them. The capability that used to live on one bench can live on every bench.
Frequently asked questions
What is streaming trace, and why does it matter? Streaming trace sends instruction trace data continuously to the host instead of relying only on the probe’s internal buffer. With the J-Trace PRO’s USB 3.0 interface, capture is limited by your disk rather than buffer size, long enough to record intermittent, hard-to-reproduce bugs.
Which cores does SEGGER J-Trace PRO support? The family covers Arm Cortex-M (M0 through M85, including M23/M33/M52/M55), Cortex-A (A5 through A72), Cortex-R (R4/R5/R8/R52) and RISC-V (E20 through E76-MC, including multi-core variants). Trace encoders supported include Arm ETM, Arm PTM and RISC-V N-Trace BTM.
Which J-Trace PRO model should I buy? If your roadmap is Cortex-M only, the J-Trace PRO Cortex-M is the most economical choice. If you ship Cortex-A/R alongside Cortex-M, the J-Trace PRO Cortex covers all three. For mixed Arm + RISC-V programmes, increasingly common in Indian SoC and automotive teams, the universal J-Trace PRO is the safer long-term bet. All four share the same 64 MB on-board buffer and unlimited streaming-trace capability.
How does J-Trace PRO connect to the target? Via a 19-pin Cortex Debug + ETM connector at 0.05” pitch, carrying four parallel trace data lines (TRACEDATA[0:3]) plus TRACECLK at up to 300 MHz TPIU. The probe also exposes Ethernet for shared lab and remote-bench setups, alongside USB 3.0 SuperSpeed to the host.
What software is included with J-Trace PRO? The package includes Ozone (SEGGER’s graphical debugger), J-Flash for flash programming, full J-Link debug capability with unlimited flash breakpoints, and free software updates.
Can J-Trace PRO help with functional-safety code coverage? Yes. It provides live code coverage and code profiling at instruction level while the target runs, producing the execution evidence that standards-driven verification depends on.
Where can I buy SEGGER J-Trace PRO in India? GSAS Micro Systems is an authorized SEGGER engineering partner in India and can arrange a J-Trace PRO evaluation on your own target hardware. See our SEGGER partner page for the full product lineup.
Where GSAS comes in
As an authorized SEGGER engineering partner in India, GSAS Micro Systems helps engineering teams put J-Trace PRO to work, from picking the right model for your architecture, to bench setup, to building coverage and profiling into your verification flow. We support the full SEGGER ecosystem alongside the broader embedded toolchain (Arm Keil MDK, Saleae Logic, Siemens EDA), so the probe lands inside a workflow that actually fits how you build.
If your team is wrestling with a bug that won’t reproduce, or staring down a coverage requirement with no clean way to satisfy it, that’s exactly the conversation we’re here for.
Talk to GSAS about a J-Trace PRO evaluation on your own target. Bring your hardest-to-catch bug, that’s the one worth tracing.
Also appears in:
Interested in SEGGER tools?
Talk to our application engineers for personalized tool recommendations.
More from SEGGER
View all →
Meet the GSAS Team at electronica India 2026, Stall H3.I45
15 Sept · 3 min
J-Link Is Now Validated by ST for StellarStudio
13 Sept · 2 min

An AI Agent That Drives the Debugger: SEGGER and Embedder Connect J-Link to the Loop
13 Sept · 6 min
SEGGER J-Link and J-Trace Now Support Andes Trace: Why This Matters for RISC-V
21 Jul · 6 min

Emulating Processor Power for Thermal Testing: Why Constant Power
7 Oct · 7 min

CRPS and Rack Power Supply Testing: The Six Tests That Matter
7 Oct · 7 min