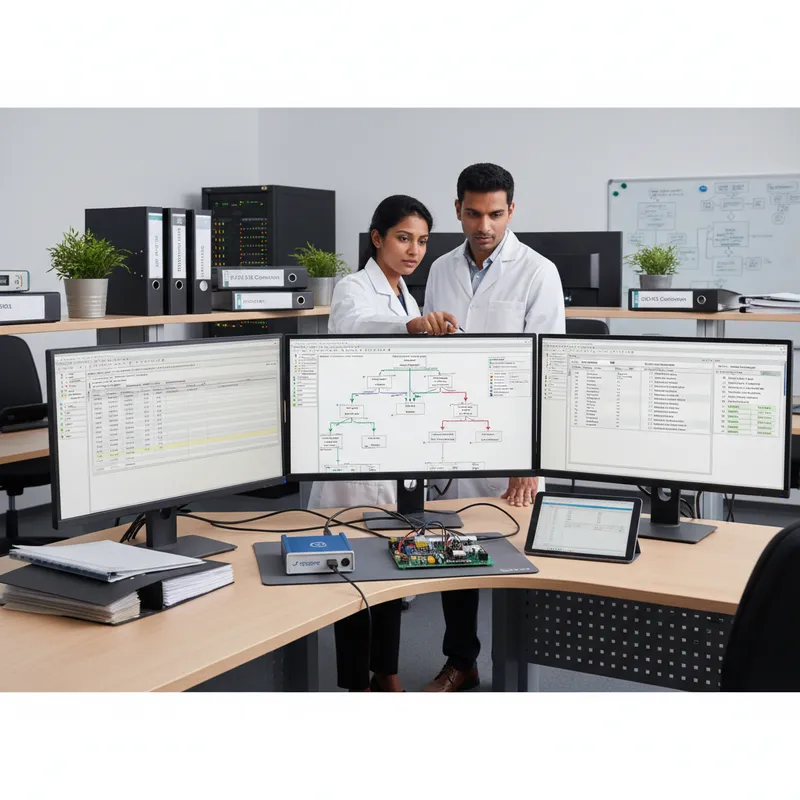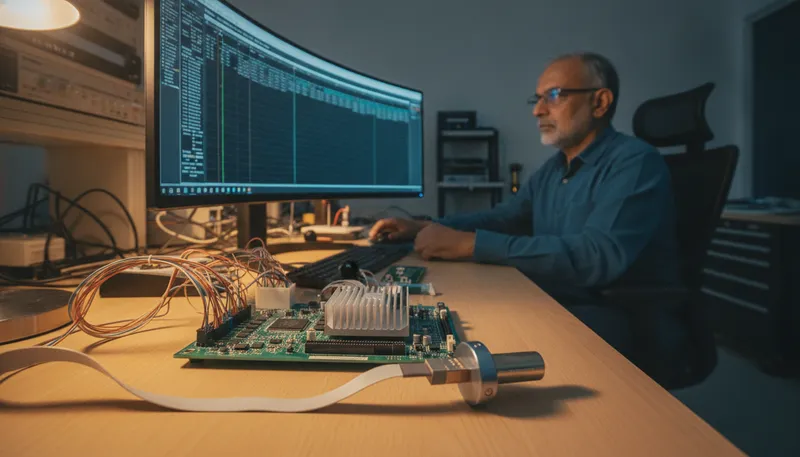
Every Indian team evaluating instruction trace eventually runs into the same two names: SEGGER J-Trace PRO and Lauterbach TRACE32. Search results often frame this as a rivalry, but the honest picture is more useful than that. For the architectures most Indian embedded programmes actually ship on, Arm Cortex-M/A/R and RISC-V, the two platforms deliver more or less similar core capability: non-intrusive streaming instruction trace, hardware code coverage, and execution profiling. Where they differ sharply is everything TRACE32 does beyond that scope, and what it costs to get there.
This post lays out that comparison honestly, using only what SEGGER and Lauterbach publish on their own websites, so an Indian engineering team can decide with real information rather than marketing language.
What is the difference between SEGGER J-Trace PRO and Lauterbach TRACE32?
For Arm and RISC-V targets, the practical difference is scope and cost, not capability. J-Trace PRO is a single probe with streaming trace, debug, and flash programming built in, at a lower price point. TRACE32 is Lauterbach’s modular, architecture-agnostic platform, covering far more silicon at a correspondingly broader cost and configuration footprint.
J-Trace PRO ships as one device: Ozone for trace visualization, J-Flash for programming, and full J-Link debug capability, all included with the probe at no added trace license. TRACE32 is built the opposite way, a PowerDebug base unit with swappable debug and trace modules purchased per architecture, so a lab can extend it core family by core family as its silicon portfolio grows. Lauterbach’s own description of TRACE32, “analyze, optimize and certify all kinds of embedded systems,” is an accurate summary of a platform built to span the entire embedded industry rather than one core family. That breadth is real and it is Lauterbach’s strength; it is also why TRACE32 configurations, and their pricing, vary project to project rather than sitting on a public price list.
What is streaming trace, and why does it matter for safety-critical software?
Streaming trace is a continuous, non-intrusive record of every instruction a CPU executes, captured through a dedicated hardware trace port (Arm ETM/PTM, or an equivalent mechanism on other architectures) without halting the core or adding timing-altering instrumentation to the code under test. That distinction matters because breakpoint debugging changes the very timing behaviour you are often trying to diagnose, a race condition or a missed deadline can disappear the moment you single-step through it.
For safety-critical software, streaming trace is the evidence source for hardware-based code coverage: statement and branch metrics come directly from the instruction stream rather than from instrumented code, and vendor analysis tooling can build the MC/DC evidence that standards such as DO-178C ask for on top of it. Both companies solve the buffer-depth problem, how long a session can run before the probe’s memory fills, differently. J-Trace PRO pairs a fixed 64 MB on-board buffer with continuous streaming over USB 3.0 SuperSpeed, so a capture session is bounded by host disk space rather than probe memory. Lauterbach’s PowerTrace line is buffer-first, up to 8 GB of dedicated trace memory on PowerTrace III, with a streaming-to-host extension layered on for longer runs. Neither approach is wrong; they reflect different product philosophies aimed at the same underlying need.
Is J-Trace PRO less expensive than TRACE32?
For an Arm Cortex-M/A/R or RISC-V trace setup specifically, yes, on cost structure if not on a like-for-like line item. SEGGER publishes J-Trace list prices directly on its own web shop, and a unit can be ordered online without a quote. Lauterbach does not publish TRACE32 list prices; its product catalog lists part numbers and specifications with no prices attached, and a working trace setup, PowerDebug base plus the correct architecture and trace modules, is configured and quoted per project through Lauterbach’s own sales channel.
That difference in pricing model reflects the difference in scope. A single-architecture J-Trace PRO probe is a fixed, publicly priced product. A TRACE32 setup is a configuration built to match whatever mix of architectures, trace modules, and software options a specific bench needs, which is also why it cannot be reduced to one number. GSAS does not carry the TRACE32 platform and cannot quote it; for Arm Cortex-M/A/R and RISC-V trace specifically, GSAS supplies J-Trace PRO in India with competitive pricing and short lead times.
Which is better for Arm Cortex-M/A/R and RISC-V trace: J-Trace PRO or TRACE32?
Within that architecture scope, both platforms capture comparable trace data with comparable fidelity, so the better choice usually comes down to what else the bench needs and what it costs to get there. The table below lays out the facts side by side, sourced from each company’s own pages.
| Capability | J-Trace PRO | TRACE32 | Notes |
|---|---|---|---|
| Architecture scope | Arm Cortex-M/A/R, RISC-V (RV32/RV64) | Over 150 architectures across 10,000+ microprocessors, including Arm/Cortex, RISC-V, RH850, TriCore/AURIX, PowerPC | TRACE32 covers far more architectures (lauterbach.com) |
| Trace capture | 64 MB on-board buffer, continuous USB 3.0 streaming | Buffer-based, up to 8 GB on PowerTrace III, plus streaming extension | Both non-intrusive; capacities per lauterbach.com |
| Debug scope | Full J-Link debug, one architecture family per probe | Heterogeneous multicore debug, OS-aware (AUTOSAR), hypervisor-aware (Bao, RTA-HVR) on RH850 | TRACE32 debugs mixed-architecture cores together (lauterbach.com) |
| Pricing model | Published list prices, web shop | Quoted per configuration via Lauterbach sales | segger.com / lauterbach.com |
Read the Notes column carefully. On architecture scope, debug depth, and multicore ability, TRACE32 is ahead, and that lead is not close. On cost transparency and getting to a working Arm/RISC-V trace session in one purchase, J-Trace PRO is ahead. Which axis matters more depends entirely on what is on your bench.
When is TRACE32 the right choice?
TRACE32 is the right choice whenever the target silicon steps outside Arm and RISC-V, or when the debug problem itself is bigger than a single core. Lauterbach has earned its position as the industry standard here over decades, and the comparison would not be honest without saying so plainly.
Renesas RH850 and other non-Arm automotive architectures. TRACE32 supports RH850 debug over JTAG, LPD4, or LPD1, and trace via on-chip Nexus messages, the parallel NEXUS AUX interface, or Aurora Gigabit off-chip trace, per lauterbach.com. J-Trace does not cover RH850 in any form, debug or trace; SEGGER’s own supported-devices database marks J-Link as unsupported across every RH850 device it lists. Infineon TriCore/AURIX sits in the same category, covered by TRACE32, not by J-Trace.
Heterogeneous multicore debug. TRACE32 can debug RH850 cores and non-RH850 cores in the same SoC at the same time, a genuine capability for automotive designs that mix architectures on one chip, per lauterbach.com.
OS-aware and hypervisor-aware debugging. TRACE32 queries and displays OS objects, threads, message queues, and the rest, for AUTOSAR and other RTOSes, and its RH850 toolchain support explicitly names the Bao Hypervisor and ETAS RTA-HVR, per lauterbach.com.
Decades of automotive tooling pedigree and a multi-vendor lab already standardised on it. A lab running PowerDebug with modules across TriCore, RH850, PowerPC, and other architectures has good reason to extend that same platform rather than introduce a second toolchain, keeping one set of scripts, one workflow, and one vendor relationship across the whole bench.
Where does J-Trace PRO fit best?
J-Trace PRO is the direct fit for the architecture profile most Indian embedded teams actually work in: Arm Cortex-M, Cortex-A, Cortex-R, or RISC-V, and nothing outside that set. For that scope, it delivers the same core capability, streaming trace, hardware coverage, and profiling, from one probe with the debugger and flash programmer included, at a lower cost point than a comparably equipped TRACE32 setup.
That makes it the practical choice for cost-conscious ISO 26262 and DO-178C programmes that need coverage evidence but do not need to cover architectures outside Arm and RISC-V, for teams standing up their first instruction-trace bench, and for any programme where the cost and configuration overhead of a modular multi-architecture platform would be spent on capability the project will never use. Pick J-Trace PRO Cortex-M for M0 through M85 targets, J-Trace PRO Cortex-A/R for application processors and real-time cores, J-Trace PRO RISC-V for RV32/RV64 silicon, or the full J-Trace PRO if the roadmap spans more than one of those.
Does J-Trace PRO support ISO 26262 and DO-178C code coverage evidence?
Yes. J-Trace PRO’s Ozone software extracts source-line, function, and instruction-level code coverage directly from the non-intrusive trace stream captured over ETM/PTM, without adding code instrumentation that would alter the timing behaviour under test. That matters for certification evidence specifically because instrumented coverage tools can change the very timing faults a safety case needs to characterise honestly.
TRACE32 supports the same class of evidence across its much wider architecture range, including RH850 programmes where AUTOSAR and hypervisor-aware debug are often part of the certification story. For Arm and RISC-V programmes specifically, J-Trace PRO reaches the same non-intrusive coverage-evidence outcome, source-line, function, and instruction-level coverage from trace, at a lower cost point. Our companion post on J-Trace PRO for ISO 26262 and DO-178C evidence in India covers the evidence workflow in more depth.
Does SEGGER J-Trace support Renesas RH850?
No, and it is worth being direct about that rather than letting a search result imply otherwise. Per SEGGER’s own supported-devices database, every RH850 device listed shows J-Link as unsupported, and J-Trace inherits the same debug and trace core as J-Link, so RH850 debug or trace is not available on any J-Trace model.
SEGGER’s RH850 relationship lives in a different product line entirely: Flasher, its standalone production programmer family. In December 2024, SEGGER expanded Flasher support to ten RH850 model families, F1L, F1K, F1KH, F1KM, C1x, P1x, D1x, E1x, E2x, and U2A, for in-circuit flash programming on the production line, not debug or trace. If your RH850 need is manufacturing-floor programming rather than lab debug or trace, our Flasher buying guide covers where that fits. If your RH850 need is debug or trace, TRACE32 is the tool built for it.
Buy SEGGER J-Trace PRO in India from GSAS
GSAS Micro Systems is an authorized SEGGER engineering partner in India, supplying the full J-Trace PRO line, J-Trace PRO, J-Trace PRO Cortex-M, J-Trace PRO Cortex-A/R, and J-Trace PRO RISC-V, with competitive pricing and short lead times. Teams in Bengaluru, Hyderabad, Chennai, Pune, Mumbai, and Delhi NCR can get on-site bring-up support to validate trace pin routing before tape-out and set up a working capture session on their own target hardware. GSAS does not carry the Lauterbach TRACE32 platform; teams whose scope requires it should reach Lauterbach directly through lauterbach.com.
A short decision framework
- What silicon is on your bench? Arm Cortex-M/A/R or RISC-V only, J-Trace PRO. RH850, TriCore/AURIX, or another non-Arm architecture anywhere in the mix, TRACE32.
- Does the bench need heterogeneous multicore or hypervisor-aware debug across mixed architectures? If yes, TRACE32. If the target is a single architecture family, either platform covers it.
- Is the lab already standardised on PowerDebug and TRACE32 scripts? Extending an existing platform is usually more efficient than introducing a second toolchain for one bench.
- Is cost transparency and a single-purchase setup a priority? J-Trace PRO’s list prices are public; a comparable TRACE32 setup is quoted per configuration.
Request a quote for J-Trace PRO, or read more on streaming trace and safety-critical evidence in our companion posts: J-Trace PRO streaming trace explained and J-Trace PRO for ISO 26262 and DO-178C evidence in India.
Also appears in:
Interested in SEGGER tools?
Talk to our application engineers for personalized tool recommendations.
More from SEGGER
View all →
Meet the GSAS Team at electronica India 2026, Stall H3.I45
15 Sept · 3 min
J-Link Is Now Validated by ST for StellarStudio
13 Sept · 2 min

An AI Agent That Drives the Debugger: SEGGER and Embedder Connect J-Link to the Loop
13 Sept · 6 min
SEGGER J-Link and J-Trace Now Support Andes Trace: Why This Matters for RISC-V
21 Jul · 6 min

Emulating Processor Power for Thermal Testing: Why Constant Power
7 Oct · 7 min

CRPS and Rack Power Supply Testing: The Six Tests That Matter
7 Oct · 7 min