
 SEGGER
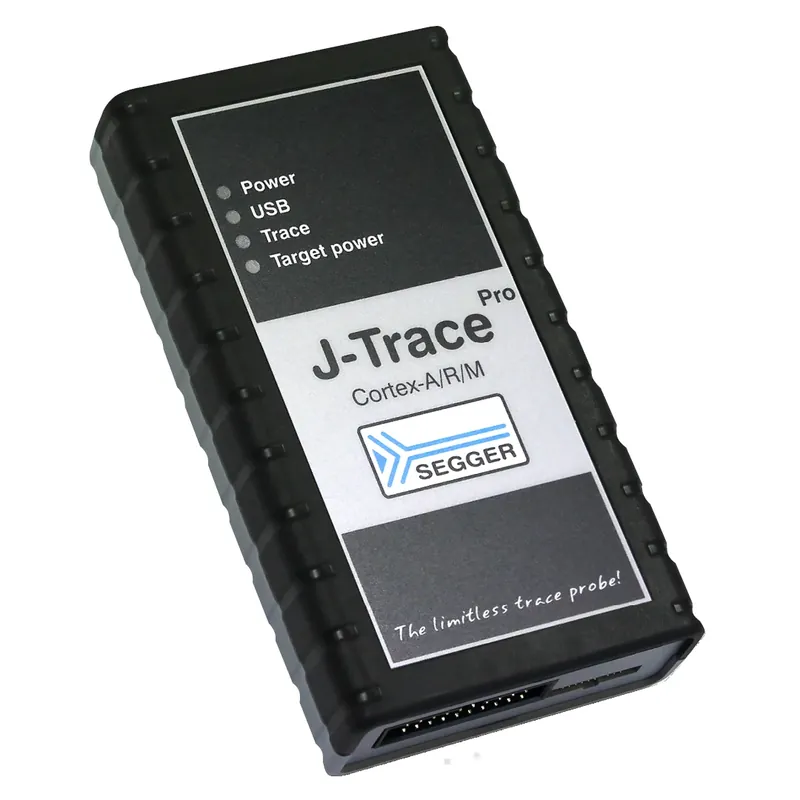
 J-Trace PRO Cortex-M
Debug & TraceDedicated Cortex-M trace probe with ETM, code coverage, and execution profiling, the entry model of the J-Trace PRO family. Available in India from GSAS with hands-on application engineering and local support.
Interface
USB 3.0 SuperSpeed
Trace
ETM, MTB, ITM, SWO, DWT
Cores
Cortex-M0 through M85
Coverage
MC/DC, branch, statement
Download
Up to 4 MB/s
Overview
About J-Trace PRO Cortex-M
The J-Trace PRO Cortex-M is the most accessible J-Trace model, delivering full trace capability for Arm Cortex-M0 through M85 microcontrollers at a competitive price. Where standard debug probes can only halt execution and inspect state at breakpoints, J-Trace captures a continuous, cycle-accurate record of every instruction executed on the target, providing a complete picture of runtime behavior that is impossible to achieve with breakpoint debugging alone.
ETM trace provides cycle-accurate, non-intrusive instruction trace that records the exact execution path of the firmware without affecting timing or behavior. This makes J-Trace indispensable for diagnosing race conditions, timing-dependent bugs, and hard faults that disappear when breakpoints are inserted. Hardware-based code coverage supports MC/DC, branch, and statement metrics for safety certification under IEC 61508, ISO 26262, and DO-178C.
Continuous trace streaming over USB 3.0 SuperSpeed handles long-running trace capture sessions without the buffer depth limitations of on-probe storage, while execution profiling identifies performance hotspots and helps optimize timing-critical firmware loops.
Trace Capabilities
| Capability | Description |
|---|---|
| ETM Trace | Cycle-accurate instruction trace, full execution history |
| MTB (Micro Trace Buffer) | Lightweight trace on Cortex-M0/M0+ with limited trace pins |
| ITM (Instrumentation Trace) | Software-instrumented event and printf trace |
| SWO | Serial Wire Output for low-bandwidth trace data |
| DWT (Data Watchpoint & Trace) | Data access trace, cycle counter, exception trace |
| Code Coverage | MC/DC, branch, statement, IEC 61508, ISO 26262, DO-178C |
| Execution Profiling | Function-level timing, hotspot identification |
| Data Trace | Monitor variable changes in real-time without halting |
| Trace Streaming | Continuous capture over USB 3.0, no buffer depth limit |
| Trace Triggering | Start/stop trace on address, data value, or event |
Full J-Link Feature Set
All J-Link features are included alongside the trace capabilities:
| Feature | Specification |
|---|---|
| Download Speed | Up to 4 MB/s |
| Host Interface | USB 3.0 SuperSpeed |
| Debug Interface | JTAG, SWD, cJTAG |
| Architectures | Arm Cortex-M0 through M85 |
| Flash Breakpoints | Unlimited |
| RTT | Real-time terminal, bidirectional |
| GDB Server | Full IDE compatibility |
| IDE Compatibility | Embedded Studio, Keil MDK, IAR EWARM, Eclipse, VS Code |
Watch the SEGGER J-Trace PRO Cortex-M introduction
The combination of full trace and standard debug in one probe means teams do not need separate devices for debug and trace workflows, the J-Trace PRO Cortex-M covers both from a single USB connection.
Blog
SEGGER Insights

Meet the GSAS Team at electronica India 2026, Stall H3.I45
electronica India 2026 opens on 16 September at BIEC Bengaluru. The GSAS team is on the floor all three days at Stall H3.I45, and this is who you will be talking to and what they can show you.
J-Link Is Now Validated by ST for StellarStudio
STMicroelectronics has fully validated SEGGER J-Link for StellarStudio, the IDE for its Stellar automotive MCU family, and put the probe into continuous validation at Le Mans. What that changes for the toolchain review on a Stellar programme, from GSAS, an authorized engineering partner for SEGGER in India.

An AI Agent That Drives the Debugger: SEGGER and Embedder Connect J-Link to the Loop
SEGGER has given an AI coding agent direct control of J-Link and J-Trace: flash, breakpoints, memory inspection and live RTT on real silicon. The loop only works if the probe can read target RAM while the core runs, and GSAS field engineers know exactly where that breaks first.
Related products
More from SEGGER
All SEGGER products →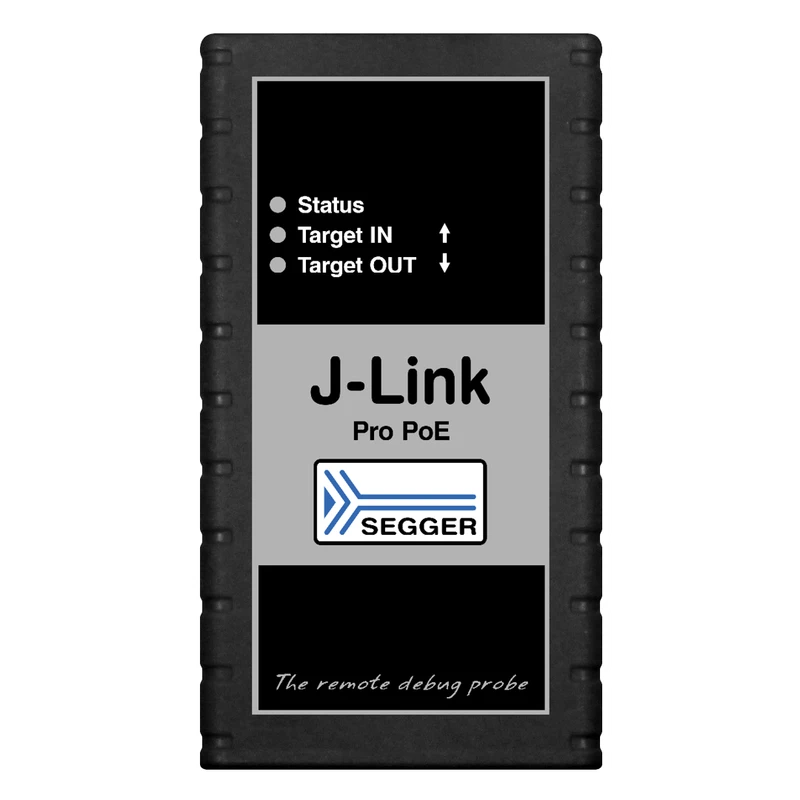
J-Link PRO PoE
Professional JTAG/SWD debug probe with USB, Ethernet, and Power over Ethernet, deploy in labs with a single cable. Available in India from GSAS.
View J-Link PRO PoE →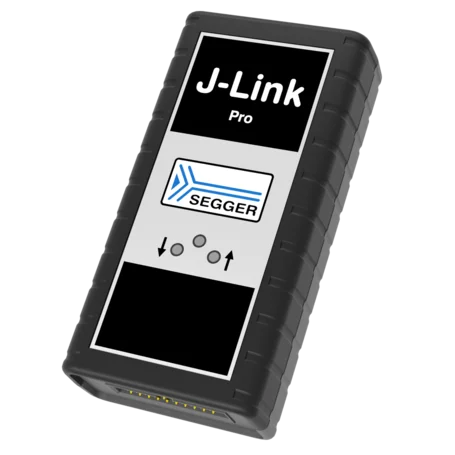
J-Link PRO
Professional JTAG/SWD debug probe with USB and Ethernet connectivity, supporting Arm Cortex-M/A/R and RISC-V architectures. India pricing and local support from GSAS.
View J-Link PRO →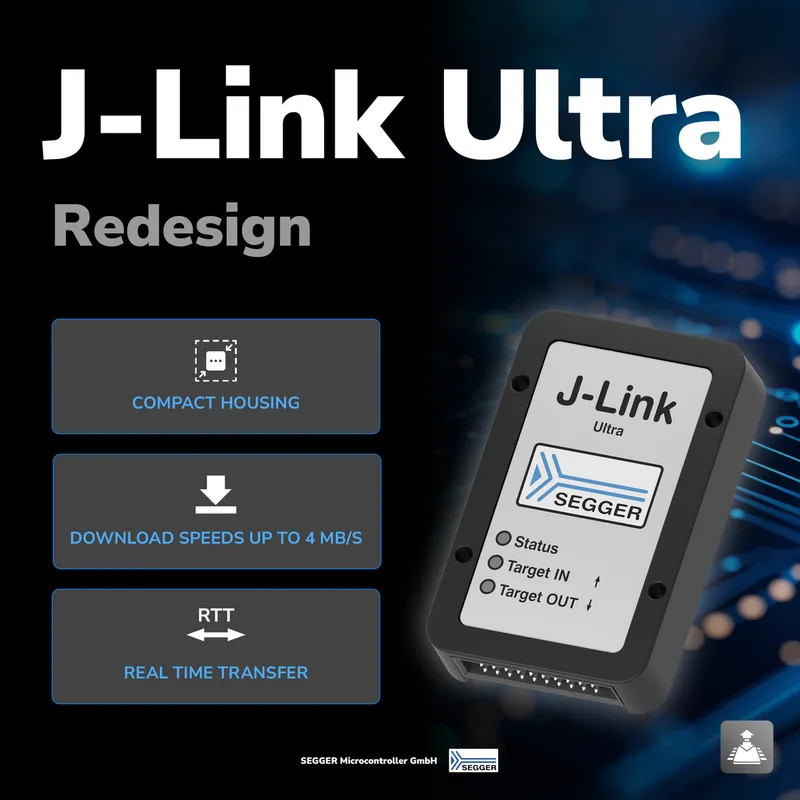
J-Link ULTRA
SEGGER's ultra-fast J-Link debug probe, now redesigned: compact USB-C housing, 4 MB/s download over USB 2.0 Hi-Speed, standard 20-pin JTAG/SWD connector. Buy J-Link ULTRA in India from GSAS Micro Systems.
View J-Link ULTRA →FAQ
Common questions about J-Trace PRO Cortex-M
What is SEGGER J-Trace PRO used for?
Does J-Trace PRO do streaming trace or on-board buffer?
Which J-Trace PRO for Cortex-M vs Cortex-A/R vs RISC-V?
What IDEs support J-Trace PRO Cortex-M?
Interested in J-Trace PRO Cortex-M?
Get pricing, an evaluation unit, or a technical consultation from our application engineers.