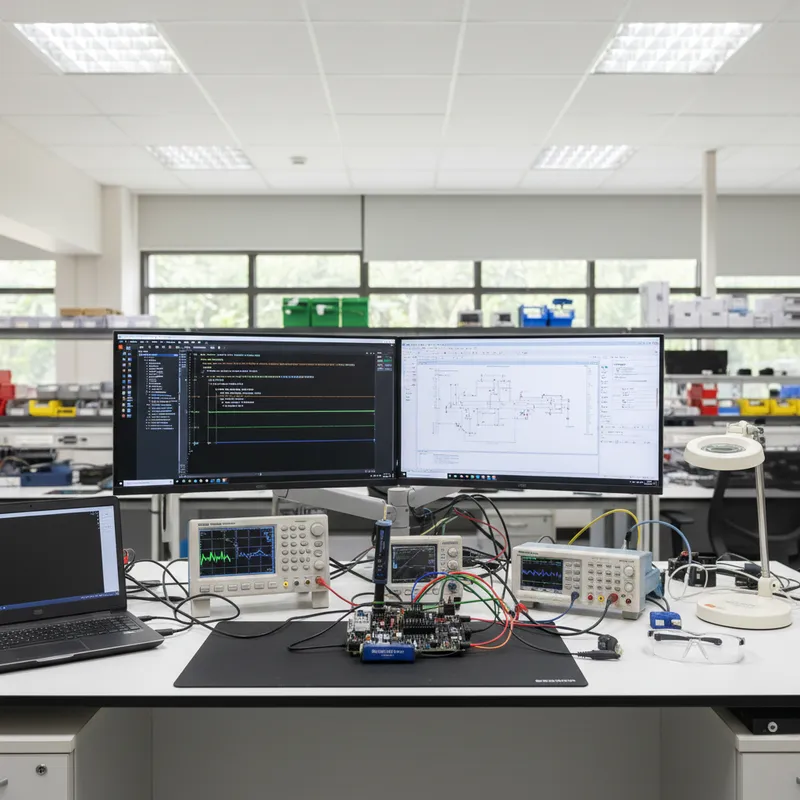
If your firmware already prints over RTT and your bench already runs J-Link, an AI agent can now sit at that bench. On 10 September 2026 SEGGER announced a collaboration with Embedder that gives the agent direct control of J-Link and J-Trace: it flashes, breaks, reads memory and watches the firmware’s own output while the target runs. Almost every claim made for AI in embedded development before this stopped at the edge of the board. This one crosses it, and what happens next depends on how your RTT is set up, not on the agent.
What SEGGER announced
SEGGER and Embedder, an AI coding agent for embedded software engineering, have connected the agent to SEGGER’s debug probes. Per SEGGER’s announcement, the agent interacts with the target much as an engineer would: “It flashes the build, sets breakpoints, inspects registers and memory, and monitors live output over RTT.” When something fails, SEGGER says, it carries on debugging on the device until the code runs.
Erik Loehr, Product Manager at SEGGER, describes the aim as enabling AI to take part in the whole embedded development cycle, “from writing code to debugging and validating it on the device.”
SEGGER states that J-Link supports “more than 15,000 devices across all major MCU families,” which is what makes the integration more than a demo: an agent wired to J-Link inherits that device coverage instead of needing a per-target adapter. The Cortex-M part you are shipping this quarter is almost certainly already on the list, and so is the one you migrate to next year.
The part that actually matters is RTT
The phrase that carries weight here is not “AI agent”. It is “monitors live output over RTT”.
Real Time Transfer is SEGGER’s mechanism for moving data between target and host through the debug interface while the target runs, with no UART, no extra pins and negligible intrusion on timing. An agent that can only flash and halt is working blind between breakpoints. An agent that can read RTT sees what the firmware is actually printing as it runs, which is the same signal a human engineer relies on when a fault only appears at speed.
That is a SEGGER capability, and this integration inherits it. An agent wired to a probe with no RTT support does not. For teams already standardised on J-Link, it is the difference between an agent that can rebuild and reflash, and one that can observe the consequences.
What will bite first on a real bench
The agent’s loop is flash, run, break, read, adjust. Every turn of it depends on J-Link reading target RAM while the core is running, and in our experience that is where the first hour of any RTT bring-up goes, long before anyone argues with the agent about a fix. An agent that reads an empty log and concludes the firmware is silent has made the same mistake a new engineer makes on day one. These are the four things our field engineers check first, and the order matters.
The host cannot find the control block. SEGGER’s knowledge base describes auto-detection as a two-step search: J-Link first looks for the control block’s address in the vector table at offset 0x20, then scans the RAM regions the J-Link software knows for the named device, and for many devices only part of the available RAM is specified, so a control block the linker has placed outside that area is never found. The same note warns that a wide search on a large-RAM part can take more than 30 seconds, and that the core name alone is not enough, the exact device name has to be passed. The fixes are mechanical: name the device precisely, and if _SEGGER_RTT has landed in external or upper RAM, pin it with SetRTTAddr or SetRTTSearchRanges in the project’s J-Link settings so the question never comes up again. An agent that reports “no output” here is not wrong about the firmware, it is looking in the wrong place.
Output is being dropped and nobody is told. SEGGER’s shipped defaults give up-channel 0 a 1024-byte buffer in SEGGER_RTT_MODE_NO_BLOCK_SKIP, where a write that does not fit is discarded whole, and SEGGER’s troubleshooting note states that every mode except SEGGER_RTT_MODE_BLOCK_IF_FIFO_FULL may lose data if the target writes faster than the host fetches it. The default exists for a good reason: non-blocking RTT never stalls the firmware when no probe is attached, so a debug build runs standalone. On a bench where an agent reads the log to decide its next move, a silent gap in a burst of prints is worse than a stall, because the diagnosis it produces is confident and wrong. Choose the mode on purpose: BLOCK_IF_FIFO_FULL for a bring-up channel where completeness matters and timing does not, a larger up buffer or NO_BLOCK_TRIM where the firmware must never wait on the host, and never the default by accident.
The target goes to sleep and the probe goes blind. SEGGER’s low-power debugging note is direct about the mechanism: some devices disable the whole debug unit in a low-power mode, so J-Link loses the connection, others keep the debug unit alive but disable flash and RAM, so background memory access fails for most of the time the core is running, and halting the core wakes the device, which is why the fault disappears the moment you stop to look at it. SEGGER’s recommendation is simply not to use low-power modes while debugging. For an automated loop that means a debug configuration with sleep entry compiled out, and a note in the project that the agent’s bench build and the production build differ in exactly this one respect.
Two readers on one channel. SEGGER’s troubleshooting list includes making sure only one host-side application fetches RTT data. On a bench where an engineer keeps J-Link RTT Viewer open out of habit while the agent’s session is also attached, one of them is reading a log with holes in it. Decide who owns the channel before the first run.
If your build already uses RTT with the mode chosen deliberately, the control block pinned and sleep out of the debug configuration, the agent inherits a bench that works. If it does not, that instrumentation is the real first step, and it pays for itself the day a human engineer chases an intermittent fault, whether or not an agent ever touches it.
See it live on 29 September
SEGGER and Embedder are running a joint webinar to demonstrate the integration.
To see the integration live, join the companies’ joint webinar on Tuesday, September 29th at 08:00 am Pacific. Registration is open at https://luma.com/6ltiyiir
For engineers in Bengaluru, Hyderabad, Chennai, Pune, Mumbai and Delhi NCR, 08:00 Pacific is 20:30 IST on the same day, Tuesday 29 September 2026. It is an evening session in India rather than a working-hours one, which is worth planning around.
Register for the SEGGER and Embedder webinar
J-Link, J-Trace and RTT support in India
GSAS Micro Systems is an authorized engineering partner for SEGGER in India. We supply the J-Link and J-Trace lines, and our field application engineers do that bench work themselves: choosing between J-Link PLUS, J-Link ULTRA and J-Link PRO for the interface speed and RTT throughput a project needs, moving to J-Trace when a fault needs instruction trace rather than a log, placing the RTT control block where the probe will find it, and picking buffer modes so that what the firmware prints is what the host reads. The agent session is run by SEGGER and Embedder. For the probe and RTT side of the loop, GSAS is the contact in India.
That work happens on benches in Bengaluru, Hyderabad, Chennai, Pune, Mumbai and Delhi NCR, on the SEGGER hardware most of those labs already own. If you want your current debug setup checked before an automated loop is pointed at it, ask an engineer a question or request a quote for the J-Link family.
Source: SEGGER, Embedder and SEGGER partnership announcement, 10 September 2026
Also appears in:
Interested in SEGGER tools?
Talk to our application engineers for personalized tool recommendations.
More from SEGGER
View all →
Meet the GSAS Team at electronica India 2026, Stall H3.I45
15 Sept · 3 min
J-Link Is Now Validated by ST for StellarStudio
13 Sept · 2 min
SEGGER J-Link and J-Trace Now Support Andes Trace: Why This Matters for RISC-V
21 Jul · 6 min
Choosing a SEGGER Flasher: Standalone vs Gang vs Secure vs Portable
17 Jul · 7 min
AI Inside the Engineering Process: What Is Worth Automating, and What Still Needs an Engineer
21 Sept · 11 min
What the Doddaballapur Facility Does, and Why That Matters to a German Engineering Team
21 Sept · 9 min