In short
Choose by architecture first, then by the evidence you need. Cortex-M teams usually start with a J-Link class probe and add ETM trace when they need coverage or timing on real hardware. Cortex-R and Cortex-A ECUs need a probe that understands CoreSight multicore systems and the trace port the silicon actually exposes. TriCore and RH850 need a probe that supports the vendor's own debug and trace interfaces. RISC-V depends on whether the core implements the RISC-V trace specifications.
Indian automotive Tier-1s rarely live on one microcontroller family. A single engineering centre in Pune or Bengaluru can be running a Cortex-M body controller, a Cortex-R based domain controller, an AURIX powertrain programme and an RH850 chassis ECU at the same time, each with its own debug interface, its own trace options, and its own idea of what “halt” means on a multicore chip.
That is why “which debug probe should we buy?” is the wrong first question. The right first question is: which architecture, and what do we need the probe to prove? This guide works through both, architecture by architecture, and links out to deeper articles where a topic needs more space than a selection guide can give it.
Start with the question, not the probe
Debug and trace tools answer three different kinds of questions. It helps to be honest about which one your programme is asking.
- Logic questions. Why does this function return the wrong value? Why does the bootloader jump to the wrong address? Halting debug answers these: breakpoints, single-step, register and memory inspection. Any competent debug probe does this.
- Time questions. How long does this interrupt take to reach its handler? Why does a task overrun once a day? What does the scheduler actually do under load? Halting the core destroys the answer, so you need trace. See timing analysis from trace.
- Evidence questions. Which instructions did the test suite execute on the real target, with the binary we ship? That is structural coverage measured from trace, and it is covered in trace-based code coverage as ISO 26262 and DO-178C evidence.
A probe that only answers logic questions is cheaper and simpler. A probe that answers time and evidence questions has to support the trace hardware on your chip, and the board has to give it a way to get that trace out. The off-chip trace explainer covers those routes.
Cortex-M: body, comfort, gateway and sensor ECUs
Cortex-M is where most Indian Tier-1 teams have the most tool experience, and where the choice is most straightforward.
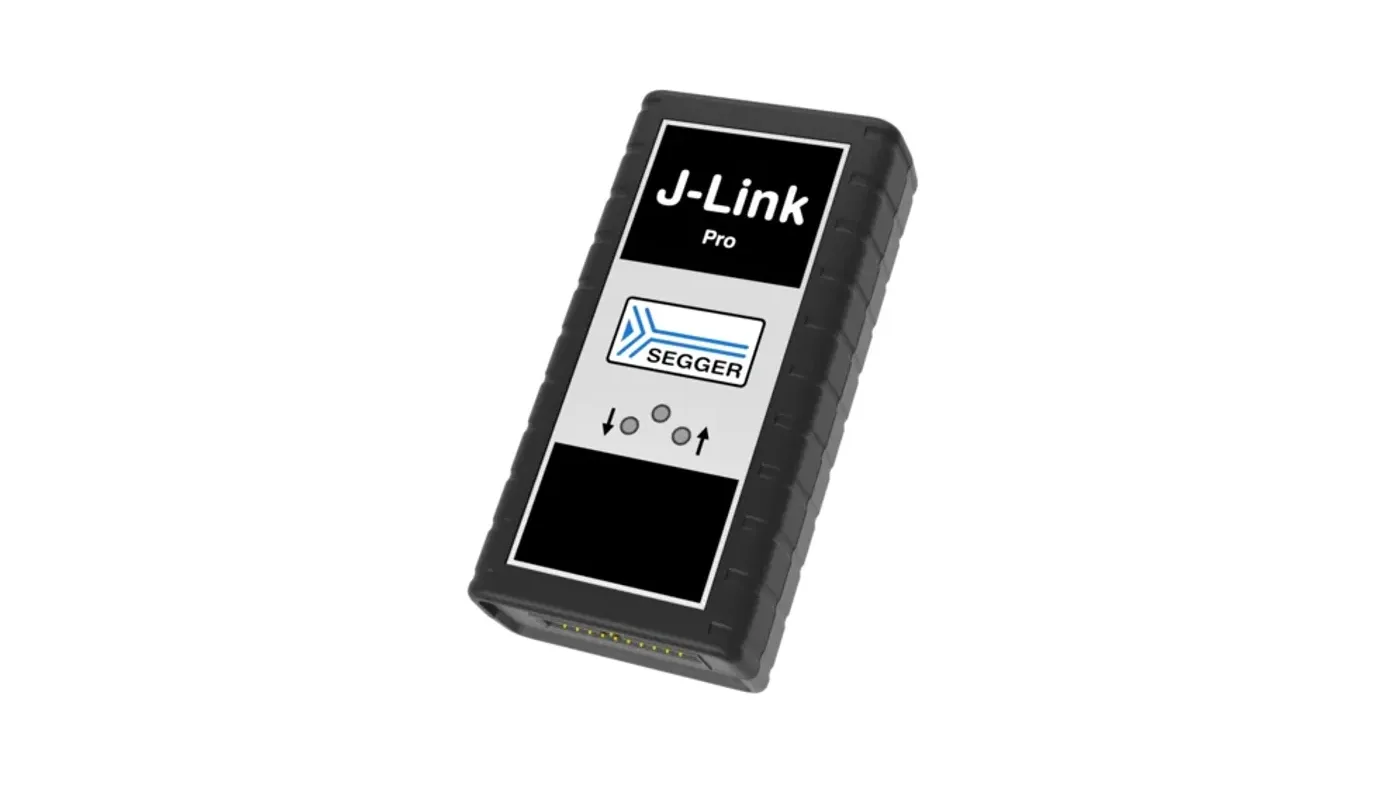
- Debug only. A J-Link class probe over SWD or JTAG covers halting debug, flash programming and, through SEGGER RTT, a fast host channel for logging. Start with the J-Link buyer’s guide if you are choosing between models.
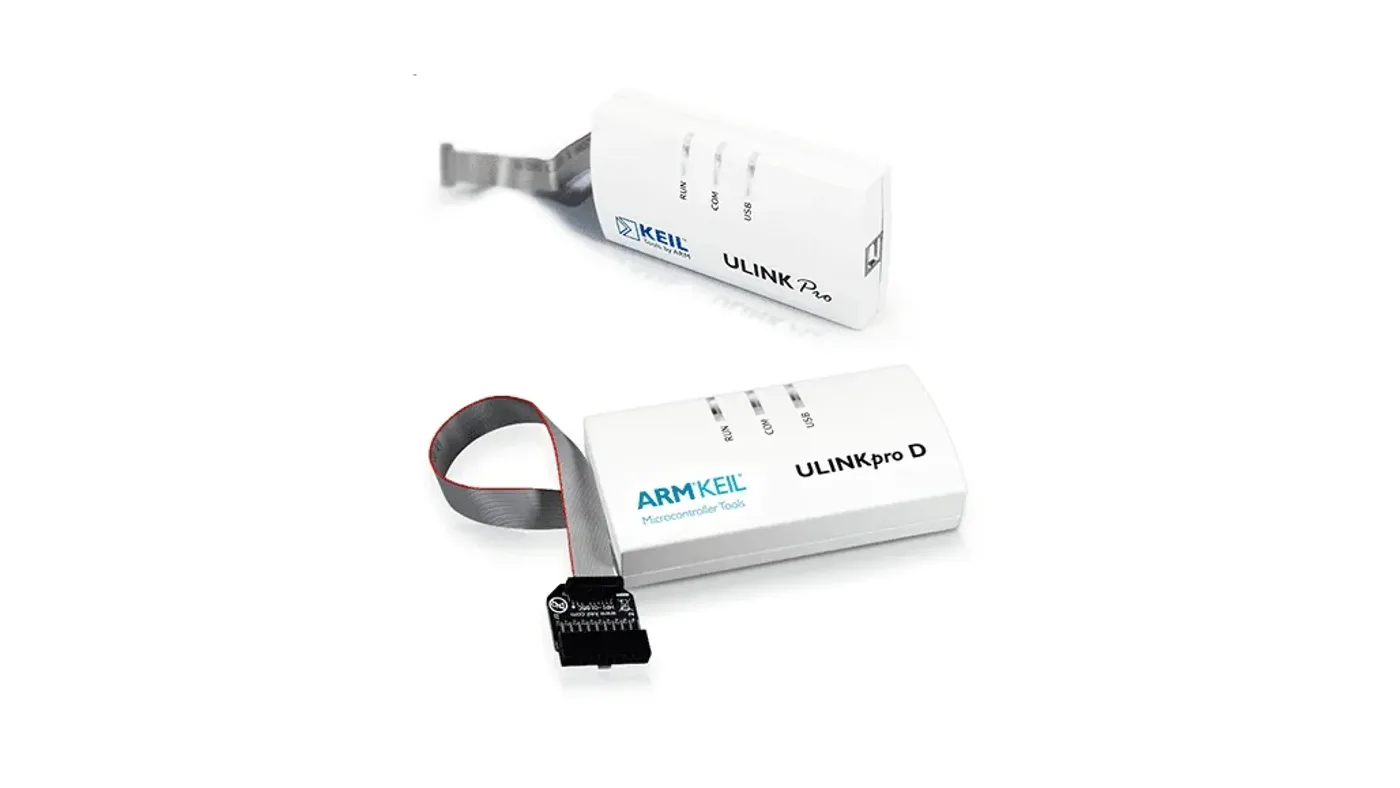
- Debug plus trace. When you need instruction trace from the ETM, the board needs the trace port pins routed to a trace connector, and the probe needs to capture them. SEGGER J-Trace PRO streams trace to the host over USB 3.0, and Arm’s ULINKpro provides ETM streaming trace for Cortex-M in Keil MDK. Which one fits depends largely on which IDE and toolchain the team already uses.
- No trace port on the board. Some Cortex-M parts offer a small on-chip buffer, and the single-pin SWO output carries instrumentation and data trace from the ITM and DWT. Those do not replace full ETM instruction trace, but they are often enough for a first look at timing.
Arm Cortex-M is also where GSAS has the deepest existing content. If you are mid-programme on a Cortex-M fault, the HardFault debug guide and the monitor-mode debugging article are more useful than another probe.
Cortex-R and Cortex-A: domain controllers, safety islands and gateways
Cortex-R cores sit in a lot of automotive safety and real-time silicon, and Cortex-A cores run the application side of gateways and domain controllers. Both live inside Arm CoreSight debug systems: several cores, each with its own debug and trace logic, connected through a shared debug access port and a trace subsystem that the silicon vendor configures.
What changes compared with Cortex-M:
- Multicore is the default. The probe and debugger have to understand the SoC’s CoreSight topology, attach to the right cores, and use the cross-trigger hardware for a coordinated halt. The multicore debug article covers lockstep, cross-triggering and synchronous halt in detail.
- Trace routes vary by chip. One device brings out a parallel trace port, another only offers on-chip trace buffers, another routes trace into system memory. Read the device’s reference manual for the trace sinks it implements before choosing a probe.
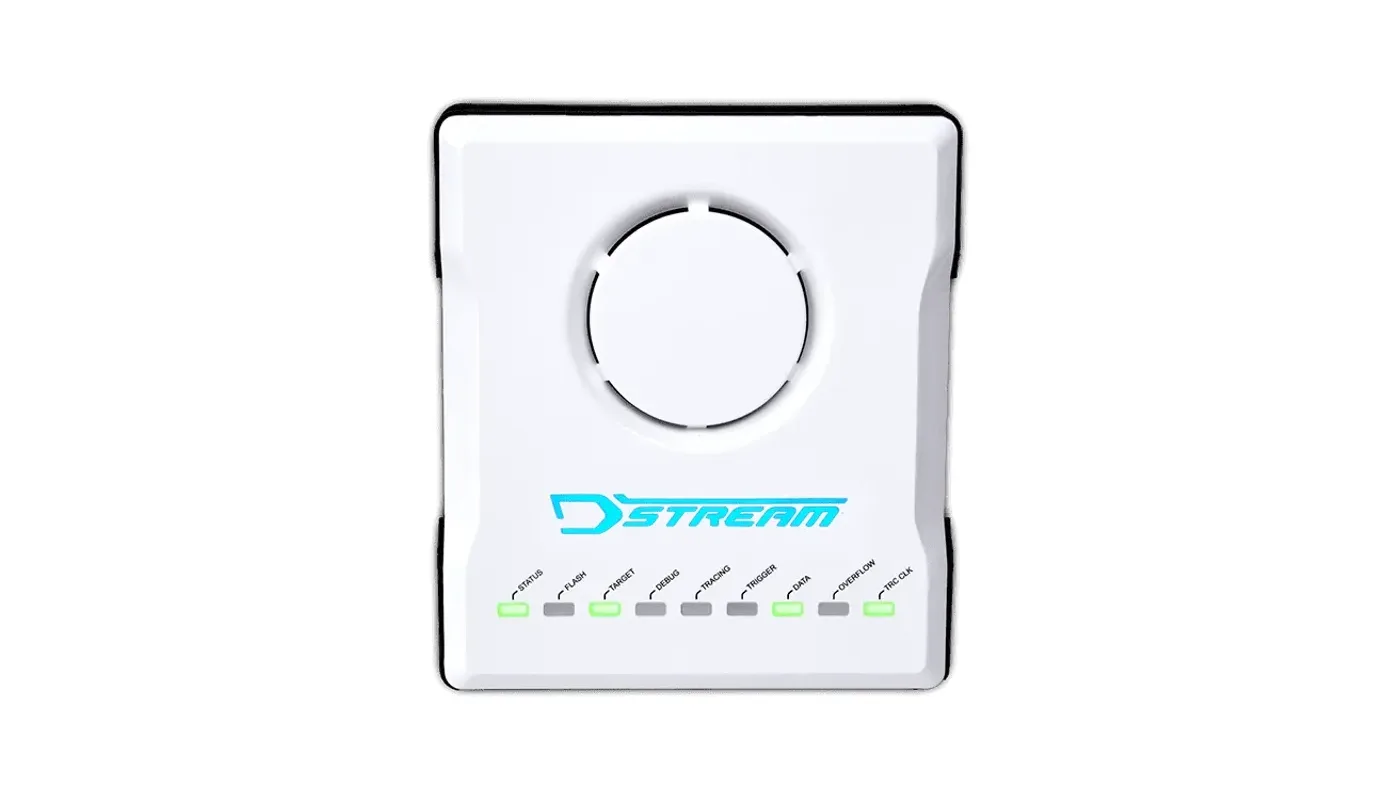
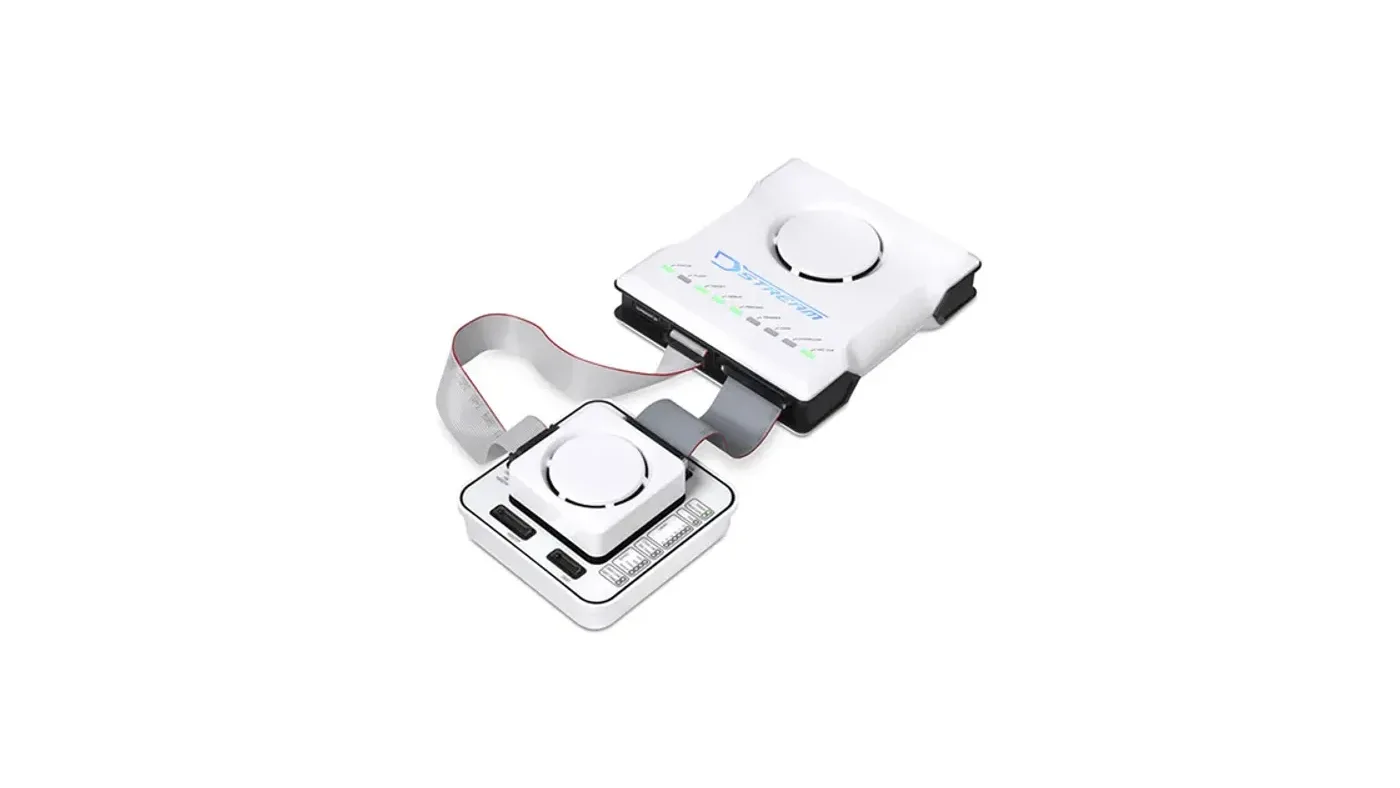
- Software matters as much as hardware. A multicore Cortex-R or Cortex-A target needs a debugger that knows the device. Arm Development Studio with DSTREAM-ST or DSTREAM-PT is Arm’s own route, and the J-Trace PRO Cortex-A/R with SEGGER Ozone is the SEGGER route. The DSTREAM field guide compares the DSTREAM models.
Infineon AURIX (TriCore): powertrain, chassis and safety controllers
AURIX is a multicore TriCore family used widely in powertrain, chassis and safety ECUs, and it is a different debug world from Arm. Infineon’s own training material describes the pieces: a low pin count Device Access Port (DAP) or JTAG for debug access, the On-Chip Debug System (OCDS), trigger lines that collect debug events from CPUs and peripherals, and a Central Suspend Switch that decides which CPUs and peripherals halt in reaction to a debug event.
Trace availability depends on the generation and the device. Infineon’s TC3xx debug training states that full trace capability comes with the MCDS module on emulation devices, while production devices use the smaller MCDSLight and MINIMCDS modules. Its TC4xx training states that TC4xx offers full MCDS tracing on production devices, over DAP, Ethernet or a serial gigabit trace interface.
That has two practical consequences. First, the probe and debugger must support the AURIX debug interface and the specific device, not just “TriCore”. Second, if your programme needs trace, plan for it early: which device variant is on the development boards, which trace interface it offers, and whether the probe supports that interface.
GSAS supplies the Hitex UAD3+, whose GSAS product page lists AURIX and RH850 among its target MCUs, and the UAD3+ multicore article and AURIX toolchain ecosystem post cover that route. For multicore AURIX trace, where the right answer depends on the exact device, the trace interface and the evidence you need, talk to our FAE team about the right probe before you commit the board design.
Renesas RH850: body, chassis and powertrain controllers
RH850 is Renesas’ automotive microcontroller family, and like AURIX it has its own debug interfaces and its own multicore debug model. Renesas’ on-chip debugger performance table lists the debug interface per series: LPD (Low Pin Debug) in 4-pin or 1-pin form for RH850/F1x, and LPD 4-pin or JTAG for the multicore RH850/E2x and U2x series. Multicore RH850 parts pair CPUs in lockstep: Renesas describes RH850/U2A with up to four G4MH CPUs plus four lockstep checker cores.
The selection questions are the same as for AURIX: which debug interface the board brings out, which device variant you are on, what trace that device actually offers, and how the probe handles multicore break and run control on that part. Answer those for your exact part number before choosing, because RH850 spans a wide range of devices. For multicore RH850 debug and trace, talk to our FAE team about the right probe for your part.
RISC-V: new silicon, new trace standards
RISC-V cores are arriving in automotive silicon, often as auxiliary or safety cores next to Arm or other application processors. Debug follows the RISC-V debug specification. Trace is where the picture is still moving: RISC-V International publishes both the Efficient Trace (E-Trace) specification and the N-Trace specification, which is based on the IEEE-5001 Nexus standard. A given core may implement one, the other, or a vendor-specific scheme.
Before choosing, ask the silicon vendor which trace encoder the core implements and how trace leaves the chip. SEGGER lists RISC-V N-Trace among the trace encoders its J-Trace probes support, and offers J-Trace PRO RISC-V. GSAS has covered RISC-V trace on Andes cores in detail.
Selection matrix
| Architecture | Typical automotive role | Debug questions to settle | Trace questions to settle | Tools GSAS supplies today |
|---|---|---|---|---|
| Cortex-M | Body, comfort, gateway, sensor ECUs | SWD or JTAG, flash programming, RTOS awareness | Trace port routed? ETM streaming or on-chip buffer? | J-Link, J-Trace PRO, ULINKpro |
| Cortex-R, Cortex-A | Domain controllers, safety islands, gateways | CoreSight topology, multicore attach, cross-trigger halt | Which trace sinks the SoC implements | Arm Development Studio with DSTREAM-ST or DSTREAM-PT, J-Trace PRO Cortex-A/R |
| AURIX TriCore | Powertrain, chassis, safety controllers | Vendor debug interface, multicore synchronous halt | Production or emulation device, which trace interface | Hitex UAD3+; talk to our FAE team about trace for your device |
| RH850 | Body, chassis, powertrain | Vendor debug interface, multicore synchronous break | Which trace the exact part offers | Hitex UAD3+; talk to our FAE team about trace for your device |
| RISC-V | Auxiliary and safety cores, new SoCs | RISC-V external debug support | Which trace encoder the core implements | J-Trace PRO RISC-V |
Five questions to answer before you raise a purchase order
- Which exact part numbers are on the boards for the next two years of programmes, not only today’s?
- Does the board bring out trace, and which interface? If it does not, can the next spin add a connector?
- What evidence does the programme need from trace: coverage, timing, or fault forensics? Each one puts different demands on capture depth and software.
- Which IDE and compiler does the team already use, and which probes does that toolchain support?
- How many seats does the team need, and does the bench need isolation? The isolated debug guide covers high-voltage targets.
Where GSAS fits
GSAS Micro Systems supplies debug and trace probes from SEGGER, Arm and Hitex in India, with INR quotations and local application engineering. Our FAE team in Bengaluru, Pune, Chennai and Hyderabad helps Tier-1 teams map a microcontroller portfolio to the right probes and configure trace on real target hardware, and we work with teams in Mumbai and Delhi NCR remotely and on site.
If your portfolio includes multicore TriCore or RH850 programmes where the trace route is still open, talk to our FAE team before the board design freezes. That is the cheapest point to get trace right.
Related reading
- Multicore debug on AURIX, RH850 and Cortex-R52
- Off-chip trace explained: ETM vs serial trace vs on-chip buffers
- Timing analysis from trace for AUTOSAR ECUs
- Non-intrusive debug of safety ECUs on production silicon
- Trace-based code coverage as ISO 26262 and DO-178C evidence
References
- Infineon, AURIX TC3xx Debug Support training (V1.0, 2020-06): https://www.infineon.com/dgdl/Infineon-AURIX_TC3xx_Debug_Support-Training-v01_00-EN.pdf?fileId=5546d46272e49d2a0172eb075eef736b
- Infineon, AURIX TC4xx Debug and Trace Support training (V1.0.0, 2024-09): https://www.infineon.com/dgdl/Infineon-AURIX_TC4x_Debug_and_Trace_Support_V1.0.pdf-Training-v01_00-EN.pdf?fileId=8ac78c8c97a5967c0197a8eef89a2a77
- Renesas, On-chip Debuggers Performance Property (debug interface per RH850 series): https://www.renesas.com/en/document/mat/chip-debuggers-performance-property?r=488801
- Renesas, RH850/U2A zone and domain microcontroller series: https://www.renesas.com/products/microcontrollers-microprocessors/rh850-automotive-mcus/rh850u2a-zonedomain-microcontroller-series
- Arm, Cortex-R52 Technical Reference Manual: https://documentation-service.arm.com/static/5ff2dd3f89a395015c28f8d4
- Arm, ULINKpro product page: https://www.arm.com/products/development-tools/debug-probes/ulink-pro
- SEGGER, J-Trace product family (supported trace encoders): https://www.segger.com/products/debug-probes/j-trace/
- RISC-V International, Efficient Trace for RISC-V (E-Trace) v2.0: https://docs.riscv.org/reference/e-trace/v2.0/preface.html
- RISC-V International, N-Trace v1.0 and IEEE-5001 Nexus compliance: https://docs.riscv.org/reference/nexus-trace/v1.0/ntrace_nexus_compliance.html
Also appears in:
Building for Automotive & Mobility?
Talk to our application engineers for personalized tool recommendations.
More from SEGGER
View all →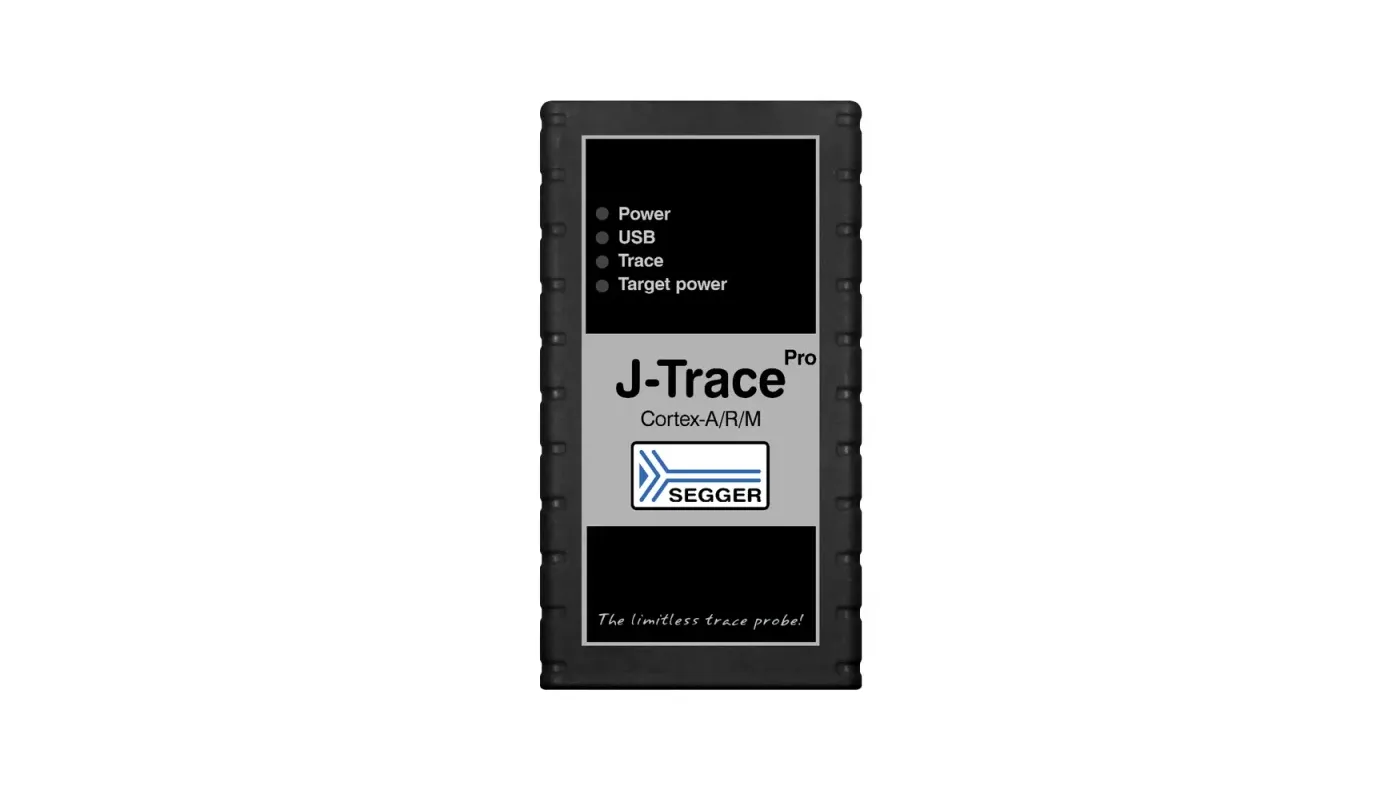
Multicore Debug on AURIX, RH850 and Cortex-R52 in India
13 Nov · 11 min
Non-Intrusive Debug of Safety ECUs on Production Silicon
13 Nov · 10 min
Off-Chip Trace Explained: ETM, Serial Trace, Trace Buffers
13 Nov · 10 min
Trace-Based Code Coverage as ISO 26262 and DO-178C Evidence
13 Nov · 11 min
Emulation vs FPGA Prototyping vs Simulation for SoC Teams
13 Nov · 8 min
GW Instek LCR-7000 and GPM-8340: New in India for 2026
13 Nov · 6 min