In short
Arm defines invasive debug as halting, breakpoints, watchpoints and stepping, and non-invasive debug as tracing instruction execution and data transfers. On a safety ECU, prefer non-invasive trace, then background memory access, then lightweight instrumentation, and halt the core only when nothing else answers the question. Production silicon usually restricts debug through authentication, so plan with the silicon vendor how trace and debug can be enabled on development and returned units.
Safety ECUs are built to react when software stops behaving normally. That is exactly what makes them hard to debug: the act of stopping the core to look at it triggers watchdogs, safety monitors and timeouts. On top of that, the production version of the silicon usually has debug access restricted and the production board usually has no trace connector.
This article ranks the techniques available on production silicon by how much they disturb the target, explains the authentication mechanisms that decide what is even possible, and covers the role of emulation devices. It is written for automotive and industrial teams in India who need to see inside a safety ECU without changing what it does.
Invasive and non-invasive, as Arm defines them
The Arm Cortex-R52 Technical Reference Manual draws the line clearly. Invasive debug features include breakpoints, watchpoints and single-stepping: they stop or alter execution. Non-invasive debug features include tracing instruction execution and tracing data transfers: they observe without stopping the core.
That distinction matters twice. It tells you which techniques preserve real-time behaviour, and on Arm processors it maps onto separate hardware enables. The Cortex-R52 takes separate authentication signals for invasive and non-invasive debug, so a silicon vendor can permit trace on a device while blocking halting debug, or block both.
The ladder: least intrusive first
| Technique | What it disturbs | What it needs | Good for |
|---|---|---|---|
| Instruction trace (ETM or vendor equivalent) | Nothing in the program; the trace hardware observes | Trace enabled by authentication, and a route off the chip or an on-chip buffer | Program flow, timing, coverage, the path into a fault |
| Data trace, PC sampling, exception trace | Nothing in the program | Trace hardware support on the core | Variable changes, statistical profiling, interrupt behaviour |
| Background memory access | Bus bandwidth only; the core keeps running | A target that allows memory access while running | Reading live variables, RTT channels |
| Lightweight instrumentation (for example RTT or SystemView) | Small amounts of added code and execution time | A buffer in target RAM and background memory access | Logging, RTOS event timelines |
| Monitor mode debugging | The debugged code path stops; selected interrupts keep running | Core and probe support for monitor mode | Motor control and power stages that must not freeze |
| Halting debug | Everything on that core | Invasive debug enabled | Logic bugs, register and memory state |
Two of these deserve a note.
Background memory access. SEGGER states that RTT can be used with any J-Link supported target that allows background memory access while the target is running. That is what lets a probe read a variable, or an RTT buffer, without stopping the core. It is a property of the target’s debug architecture, so confirm it for your part. See the SEGGER RTT technical guide.
Monitor mode. SEGGER describes monitor-mode debugging as the CPU taking a debug interrupt instead of halting, so the core keeps running and can still handle some interrupts while the application itself is halted and inspected. It sits between trace and halting on the ladder. The monitor mode article explains when it is the right choice.
Debug authentication on production silicon
Production microcontrollers rarely ship with debug fully open. How access is restricted, and how it can be re-enabled for development or failure analysis, is defined by the silicon vendor and is often part of the device’s security architecture.
- On Arm processors, the authentication signals that gate invasive and non-invasive debug are driven by the SoC, so the silicon vendor decides how they are controlled. On the Cortex-R52 the TRM names separate signals for invasive and non-invasive debug.
- On Infineon AURIX, Infineon’s TC4xx debug and trace training states that on AURIX TC3xx tracing was only possible when debugging was enabled, and that on AURIX TC4xx the two are decoupled. That is a meaningful change for teams who want trace on a part where halting stays locked.
Cybersecurity teams treat open debug access on production ECUs as an attack surface, which is why parts are locked in the first place. Our UNECE R155/R156 page covers the regulatory side. The engineering rule is simple: agree the unlock procedure for development boards and returned units with the silicon vendor before production, and design it so it cannot be used to open a vehicle in the field.
Production devices and emulation devices
Several automotive microcontroller families have two kinds of silicon:
- Production devices, the parts that ship.
- Emulation devices, variants with additional debug and trace hardware for development boards.
Infineon’s AURIX TC3xx training states that full trace capability comes with the MCDS module on emulation devices, while production devices use the smaller MCDSLight and MINIMCDS modules. Its TC4xx training states that TC4xx offers full MCDS tracing on production devices. On RH850, Renesas offers an emulation adapter carrying an emulation chip for G4MH core devices for use with its E2 emulator.
The practical point: decide which evidence must come from the shipping silicon and which can come from an emulation device, and write that decision into the verification plan. Coverage and timing evidence collected on an emulation device needs an argument for why it represents the production part.
When the board has no trace connector
Production ECUs rarely carry a trace connector, and there are still options:
- On-chip trace buffers. Many Arm-based devices implement ETB or ETR trace sinks, which keep a window of recent execution inside the chip for the debugger to read later over the normal debug connection. Arm documents these in its CoreSight Trace Memory Controller.
- Trace read over the debug port. On AURIX, Infineon’s TC3xx training states that DAP or Aurora can be used as trace interfaces depending on trace complexity, so lower-bandwidth trace can be read over the debug interface. On TC3xx that requires debug to be enabled, as noted above.
- A development variant of the board with the trace connector populated, built from the same schematic and layout as production where possible.
The off-chip trace explainer compares these routes in detail.
A plan that works
- At architecture, list the questions you expect to ask of the ECU in development and after a field return, and which ones need trace.
- At silicon selection, confirm what trace the production part supports, whether trace can be enabled independently of halting debug, and what the emulation device adds.
- At schematic, route the debug connector on every board and a trace connector on development boards.
- Before production, agree and document the debug unlock procedure for returned units.
- In verification, prefer non-invasive evidence and record which silicon variant each piece of evidence came from.
Tools GSAS supplies today
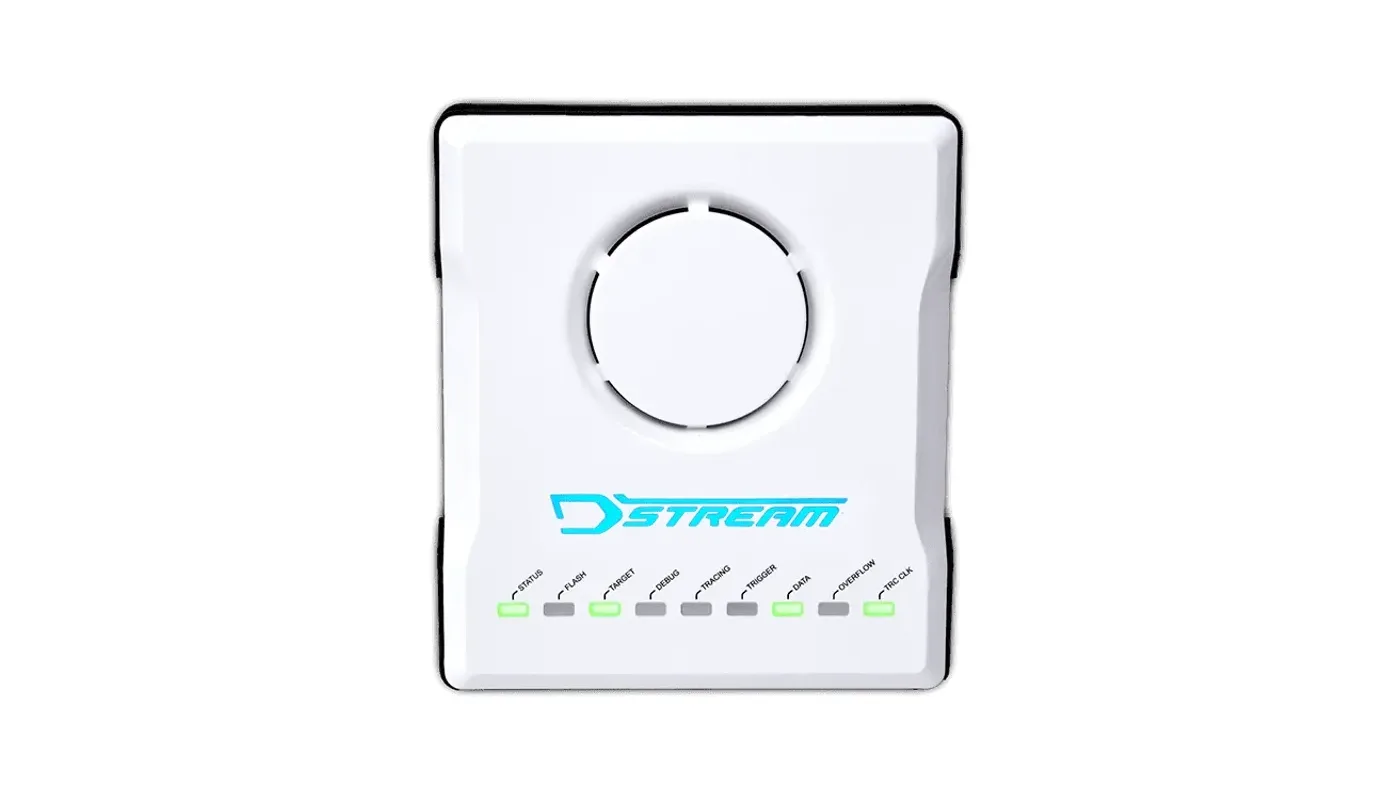
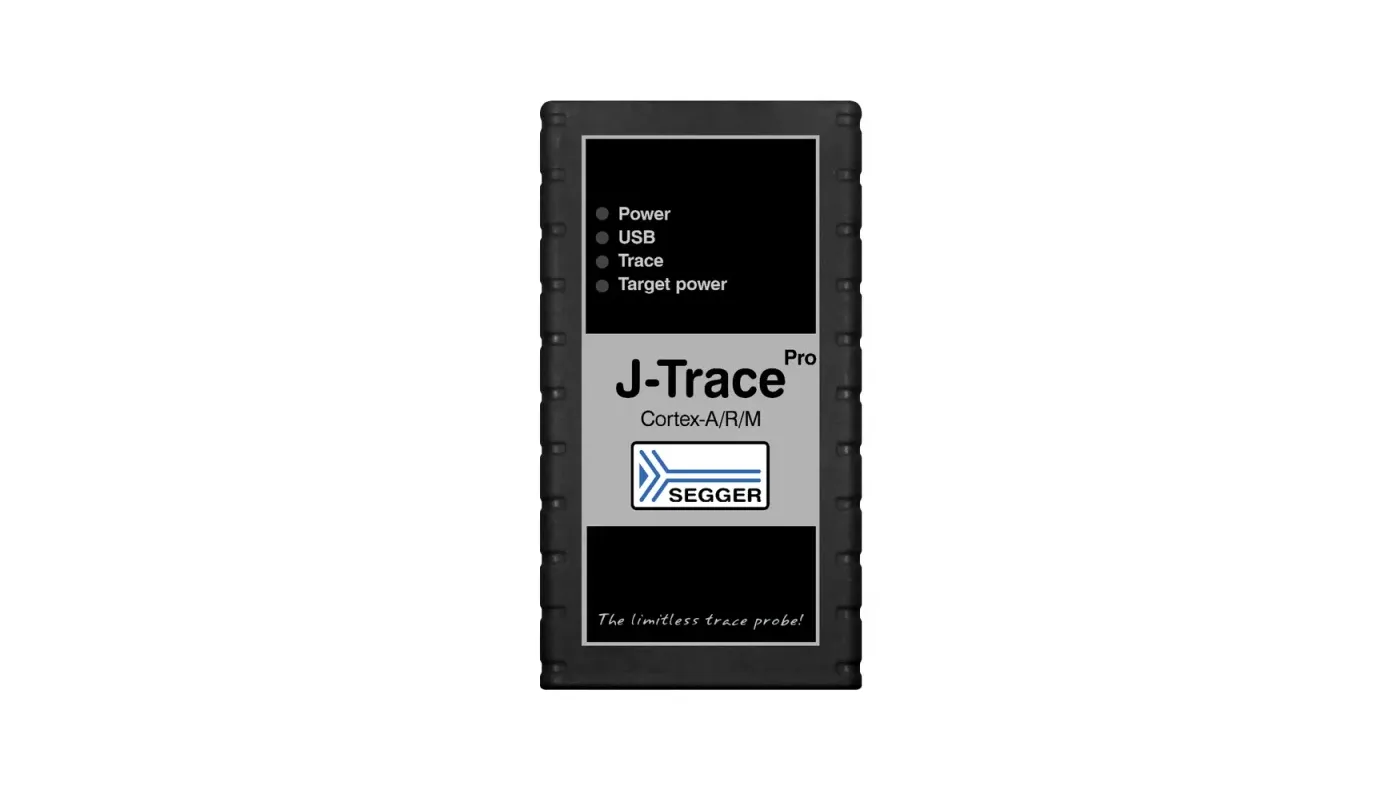
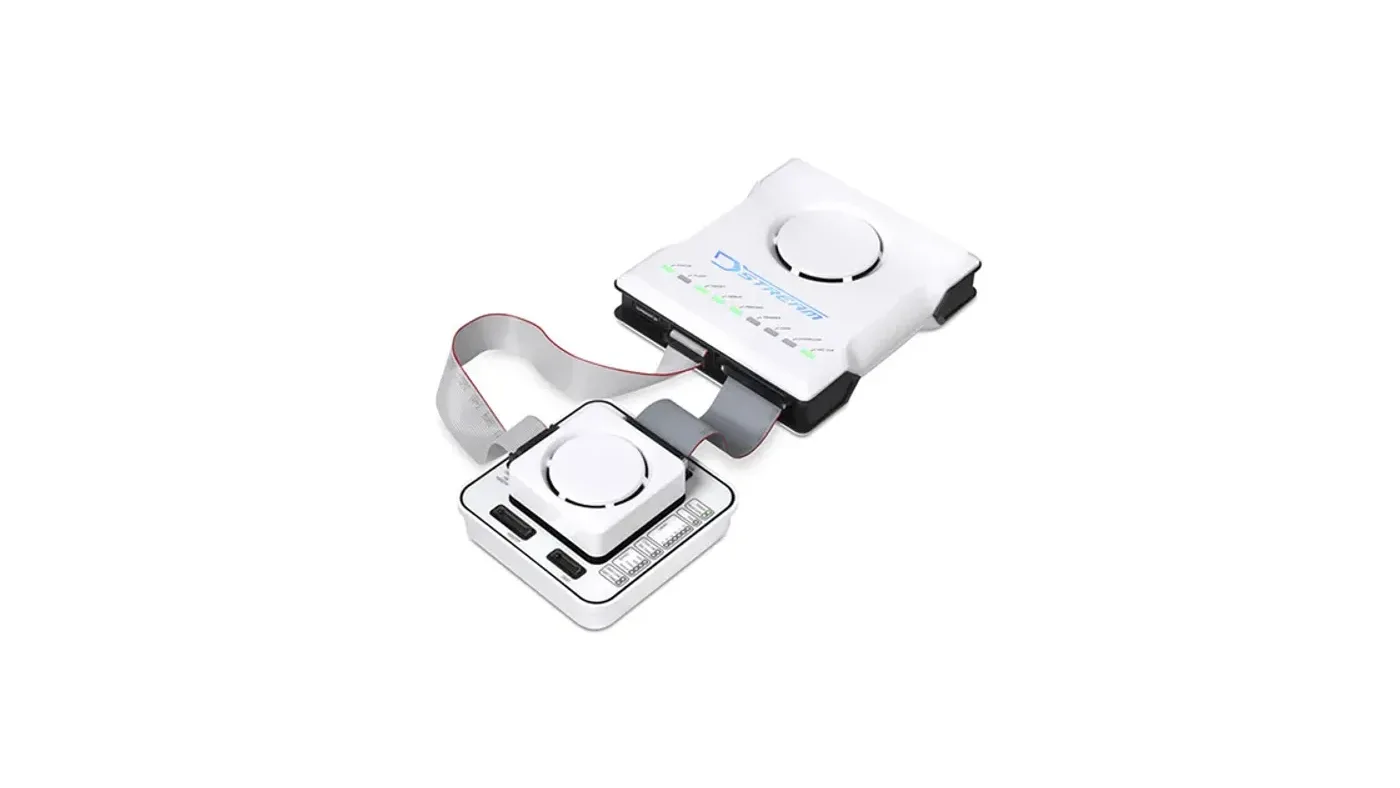
- Streaming instruction trace on Arm and RISC-V: SEGGER J-Trace PRO with Ozone, and Arm DSTREAM-ST, which Arm describes as containing no trace RAM and streaming all trace data to the host.
- Background memory access and RTT: SEGGER J-Link PRO and the wider J-Link range.
- Multicore Arm: Arm Development Studio with DSTREAM probes.
- Isolated benches for high-voltage targets: see the isolated SWD and JTAG guide.
For production AURIX/TriCore and RH850 parts, where trace and unlock options differ device by device, talk to our FAE team about the right probe and debug strategy.
Where GSAS fits
GSAS Micro Systems supplies debug and trace probes in India with INR quotations and local application engineering. Our engineers in Bengaluru, Pune, Chennai and Hyderabad help safety ECU teams plan observability from silicon selection onwards, and support teams in Mumbai and Delhi NCR on site and remotely.
Related reading
- Trace-based code coverage as ISO 26262 and DO-178C evidence
- Multicore debug on AURIX, RH850 and Cortex-R52
- Instruction trace evidence for Indian safety-critical teams with J-Trace PRO
- Choosing debug and trace tools for Indian automotive Tier-1s
References
- Arm, Cortex-R52 Technical Reference Manual (invasive and non-invasive debug, authentication): https://documentation-service.arm.com/static/5ff2dd3f89a395015c28f8d4
- Arm, CoreSight Trace Memory Controller: https://www.arm.com/products/silicon-ip-system/coresight-debug-trace/coresight-tmc
- Arm Community, “Arm announces DSTREAM-ST”: https://developer.arm.com/community/arm-community-blogs/b/tools-software-ides-blog/posts/arm-announces-dstream-st
- Infineon, AURIX TC3xx Debug Support training (V1.0, 2020-06): https://www.infineon.com/dgdl/Infineon-AURIX_TC3xx_Debug_Support-Training-v01_00-EN.pdf?fileId=5546d46272e49d2a0172eb075eef736b
- Infineon, AURIX TC4xx Debug and Trace Support training (V1.0.0, 2024-09): https://www.infineon.com/dgdl/Infineon-AURIX_TC4x_Debug_and_Trace_Support_V1.0.pdf-Training-v01_00-EN.pdf?fileId=8ac78c8c97a5967c0197a8eef89a2a77
- Renesas, E2 emulator (RH850 emulation adapter): https://www.renesas.com/en/software-tool/e2-emulator-rte0t00020kce00000r
- SEGGER, About Real Time Transfer (background memory access): https://www.segger.com/products/debug-probes/j-link/technology/about-real-time-transfer/
- SEGGER, Monitor-mode debugging: https://www.segger.com/products/debug-probes/j-link/technology/monitor-mode-debugging/
Also appears in:
Building for Automotive & Mobility?
Talk to our application engineers for personalized tool recommendations.
More from Arm
View all →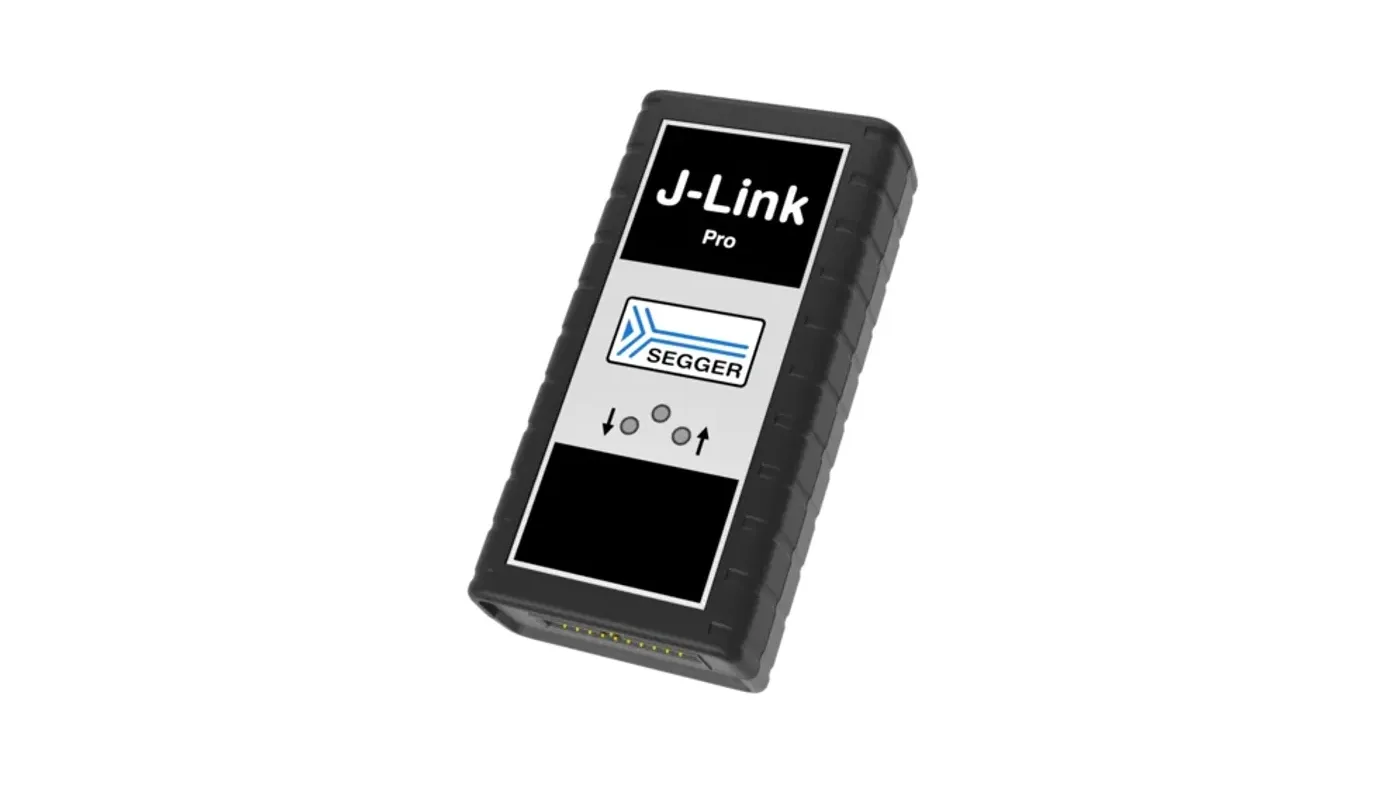
Choosing Debug and Trace Tools for Indian Automotive Tier-1s
13 Nov · 11 min
Multicore Debug on AURIX, RH850 and Cortex-R52 in India
13 Nov · 11 min
Off-Chip Trace Explained: ETM, Serial Trace, Trace Buffers
13 Nov · 10 min
Trace-Based Code Coverage as ISO 26262 and DO-178C Evidence
13 Nov · 11 min
Emulation vs FPGA Prototyping vs Simulation for SoC Teams
13 Nov · 8 min
GW Instek LCR-7000 and GPM-8340: New in India for 2026
13 Nov · 6 min