In short
Multicore debug is about controlling what the rest of the chip does when one core stops. On Arm Cortex-R52, a Cross Trigger Interface on each core and a Cross Trigger Matrix pass debug events between cores. On Infineon AURIX, trigger lines collect debug events and a Central Suspend Switch decides which CPUs and peripherals halt in response. Lockstep checker cores run alongside their main core for fault detection; you debug the main core. Configure these together, including peripheral and watchdog behaviour, before chasing inter-core bugs.
A single-core debug session is easy to reason about: the core stops, the world waits. On a multicore safety microcontroller the world does not wait. When you halt one core, the others keep running, peripherals keep counting, watchdogs keep ticking and communication partners keep expecting answers. The bug you were chasing on core 0 can disappear, and three new ones can appear on core 2.
This article explains the three mechanisms that decide whether a multicore debug session tells you the truth: lockstep, cross-triggering and synchronous halt. It covers the three architectures Indian automotive teams meet most often in safety ECUs, Infineon AURIX (TriCore), Renesas RH850 and Arm Cortex-R52, using the silicon vendors’ own public documentation. For the Arm Cortex-M dual-core devices on consumer and industrial boards, see our multi-core debug guide for i.MX RT1170, nRF5340 and RP2350.
Why multicore debug is a different problem
Three things change when a chip has more than one core.
- Shared state. Cores exchange data through shared memory, mailboxes and inter-core interrupts. Stopping one side of an exchange changes the timing of the other.
- Safety reactions. Safety ECUs are designed to notice when something stops responding. A halted core looks exactly like a failed core to a watchdog or a monitoring partner.
- Peripherals. Timers, PWM units and communication controllers do not know that a developer pressed “stop”. Unless they are configured to suspend, they keep running.
The debug hardware on these chips exists to manage exactly these effects. The skill is in configuring it deliberately rather than accepting whatever the debugger’s defaults are.
Lockstep: two cores, one program
Lockstep is a hardware safety mechanism. A checker core executes the same instruction stream as the main core, and a comparator checks that their outputs match. A mismatch is reported as a fault to the chip’s safety logic. It detects random hardware faults in the core; it does not give you a second core to run code on.
Arm and Renesas document it publicly for the parts below. For AURIX, check the device manual for which CPUs have lockstep checkers.
- Arm Cortex-R52. The Cortex-R52 Technical Reference Manual describes a processor of one to four cores, with an optional Dual-Core Lock-Step (DCLS) configuration.
- Renesas RH850. Renesas describes the RH850/U2A series with up to four G4MH CPUs plus four lockstep cores, and the RH850/E2UH with six cores including four lockstep dual cores.
What lockstep means for debug. You load, halt, step and inspect the main core. The checker’s job is to follow it, and how the debug logic treats a lockstep pair is defined per device, so read the debug chapter of your device manual before assuming anything. Testing the lockstep comparator itself is a safety-mechanism activity done through the safety mechanism’s own test features, not through the debugger. Teams working on AURIX safety self-test should read the SafeTpal vs in-house self-test comparison.
Cross-triggering: passing debug events between cores
Cross-triggering lets an event on one core cause an action somewhere else: halt another core, start or stop trace, raise a trigger output.
Arm Cortex-R52
The Cortex-R52 Technical Reference Manual describes a Cross Trigger Interface (CTI) for each core and a Cross Trigger Matrix (CTM) that connects them. Events from a core’s debug logic or ETM enter its CTI, travel across the matrix on channels, and leave through other CTIs as actions. The same mechanism is used across Arm CoreSight systems, and the Linux kernel’s CoreSight documentation calls it cross-triggering.
In practice your debugger programs the CTIs. When you tell Arm Development Studio to stop all cores together, the CTIs and CTM are what carry that request.
Infineon AURIX
AURIX uses Infineon’s own mechanism. Infineon’s AURIX TC3xx Debug Support training describes trigger lines that collect debug events from CPUs, interrupt requesters, peripherals, the MCDS trace module and input pins, and a Central Suspend Switch that lets the user configure which CPUs or peripherals are halted as a reaction to a debug event. The debug system itself is the On-Chip Debug System (OCDS).
Renesas RH850
Renesas documents RH850 debug per device family. For multicore break behaviour, the device’s hardware manual and your debugger’s documentation are the authority, and behaviour can differ between series. Confirm how a break on one G4MH core affects the others on your exact part before you rely on it.
Synchronous halt, and why “synchronous” needs care
“Synchronous halt” means stopping all relevant cores in response to one event. Two things are worth understanding before relying on it.
- It is a configuration, not a default. On both CTI-based Arm systems and AURIX, which cores and peripherals react to a debug event is set up by the debugger. If the setting is wrong, one core stops and the rest run on.
- Signals take time to propagate. A halt request crosses hardware between cores, so the other cores stop shortly after the first one, not on the same instruction. The precise behaviour is device-specific. If your bug is about the exact interleaving of two cores, a coordinated halt shows you the state afterwards, but only trace shows you the interleaving itself.
Peripherals and watchdogs during a halt
This is where most “the ECU resets when I debug” problems come from.
- Decide per peripheral whether it should suspend. On AURIX, the Central Suspend Switch covers peripherals as well as CPUs. Arm-based microcontrollers provide per-peripheral debug freeze controls that differ by silicon vendor, documented in the device reference manual.
- Suspend or disable watchdogs for debug sessions in a way that cannot ship to production. A watchdog that keeps running during a breakpoint will reset the chip, and a safety watchdog that is disabled in a production build is a defect.
- Think about the network. Halting an ECU on a live CAN or Ethernet bench makes it vanish from the bus, which can cause other ECUs to raise faults. Bench a single ECU, or accept and filter those faults.
Trace across cores
Coordinated halt shows you the state after something went wrong. Trace shows you how the cores got there. Each Cortex-R52 core has its own ETM implementing ETMv4.2, according to Arm’s TRM, and the SoC’s CoreSight trace subsystem can combine those streams. On AURIX, Infineon’s TC3xx training says full trace capability comes with the MCDS module on emulation devices, with smaller MCDSLight and MINIMCDS modules on production devices, while its TC4xx training says TC4xx offers full MCDS tracing on production devices. The off-chip trace explainer covers how trace leaves the chip, and timing analysis from trace covers what to do with it.
A setup checklist for a multicore debug session
- Identify which cores run what, which are lockstep pairs, and which cores you actually need to control.
- Decide which events should halt which cores, and configure the debugger’s cross-trigger or suspend settings explicitly.
- Decide which peripherals suspend with the cores, starting with timers and watchdogs.
- Make the debugger RTOS-aware for each core if the cores run an operating system.
- If the bug is about interleaving or timing, set up trace before you set breakpoints.
Tools GSAS supplies today
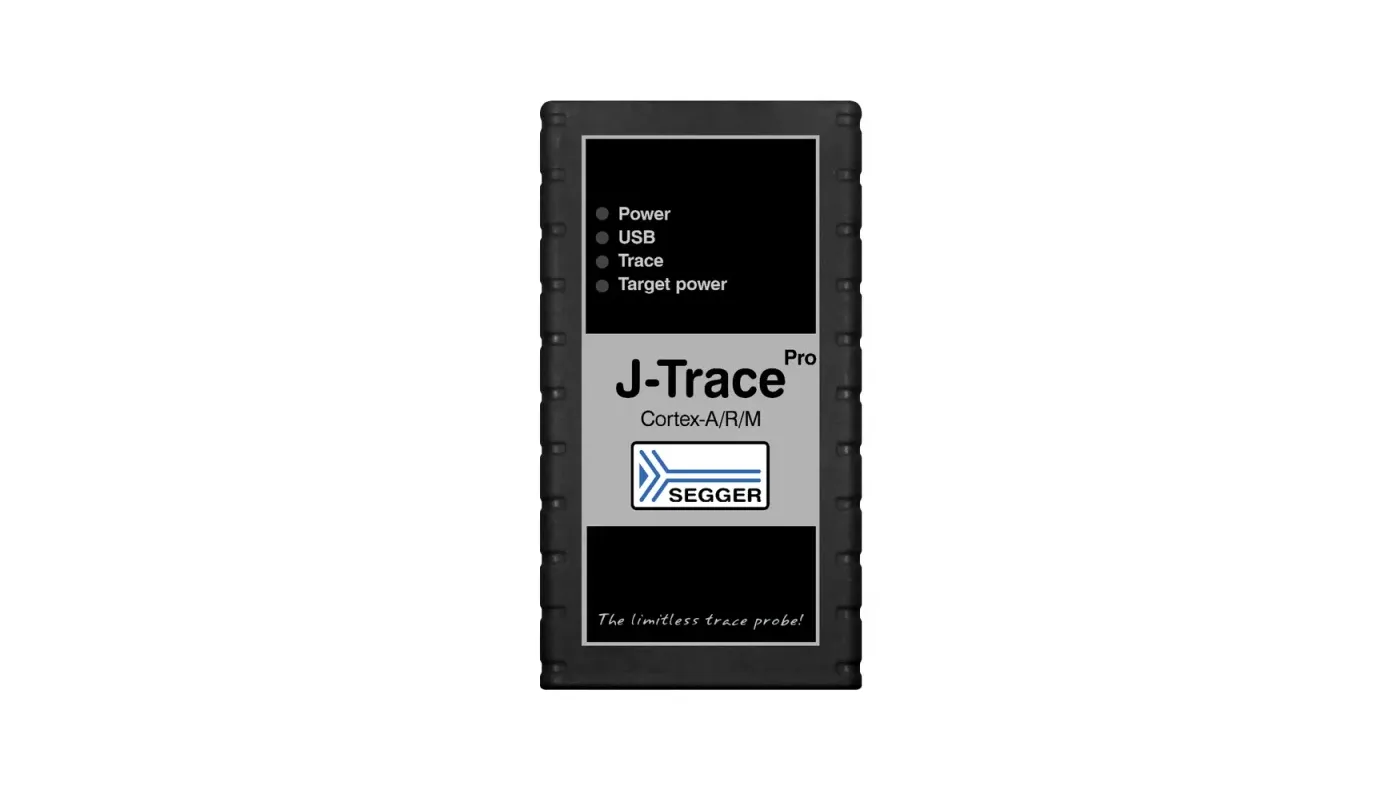
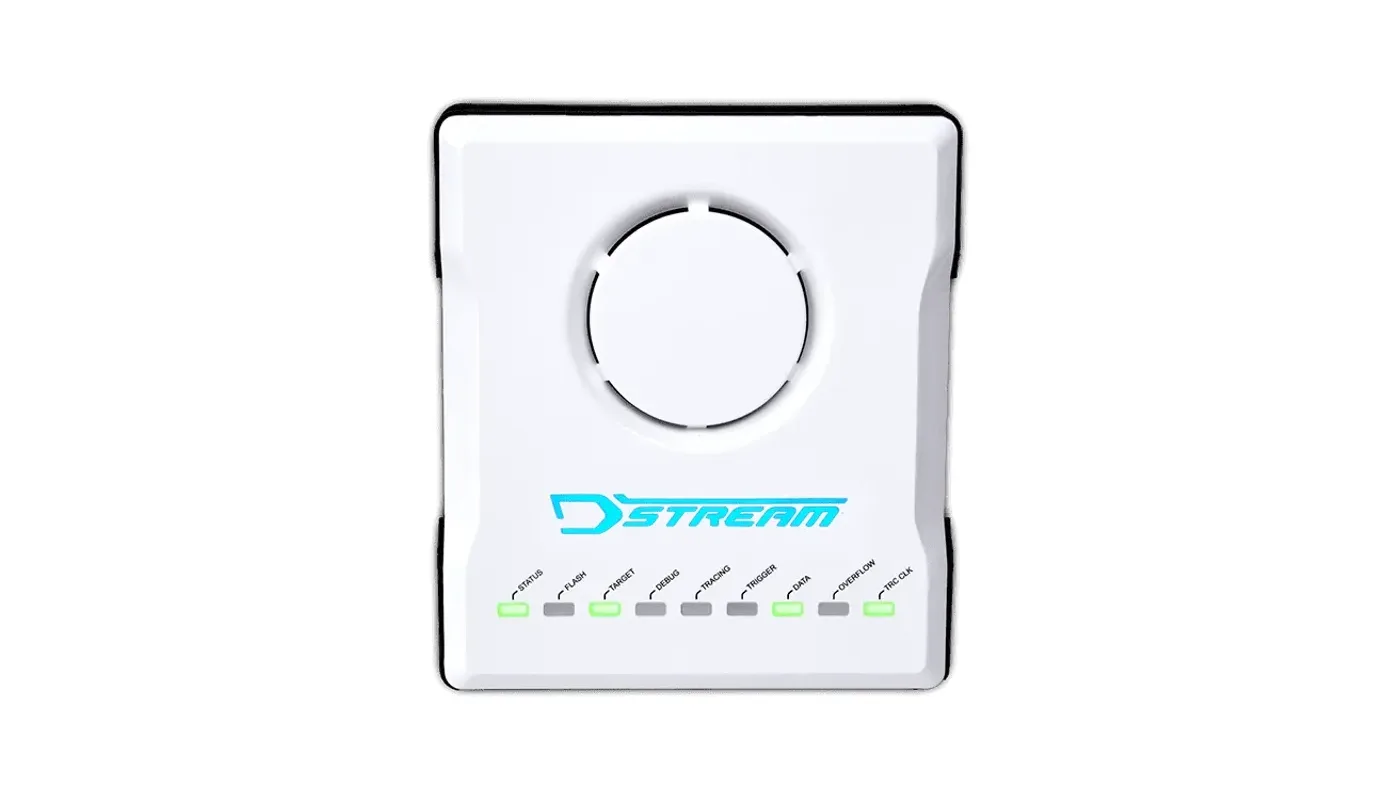
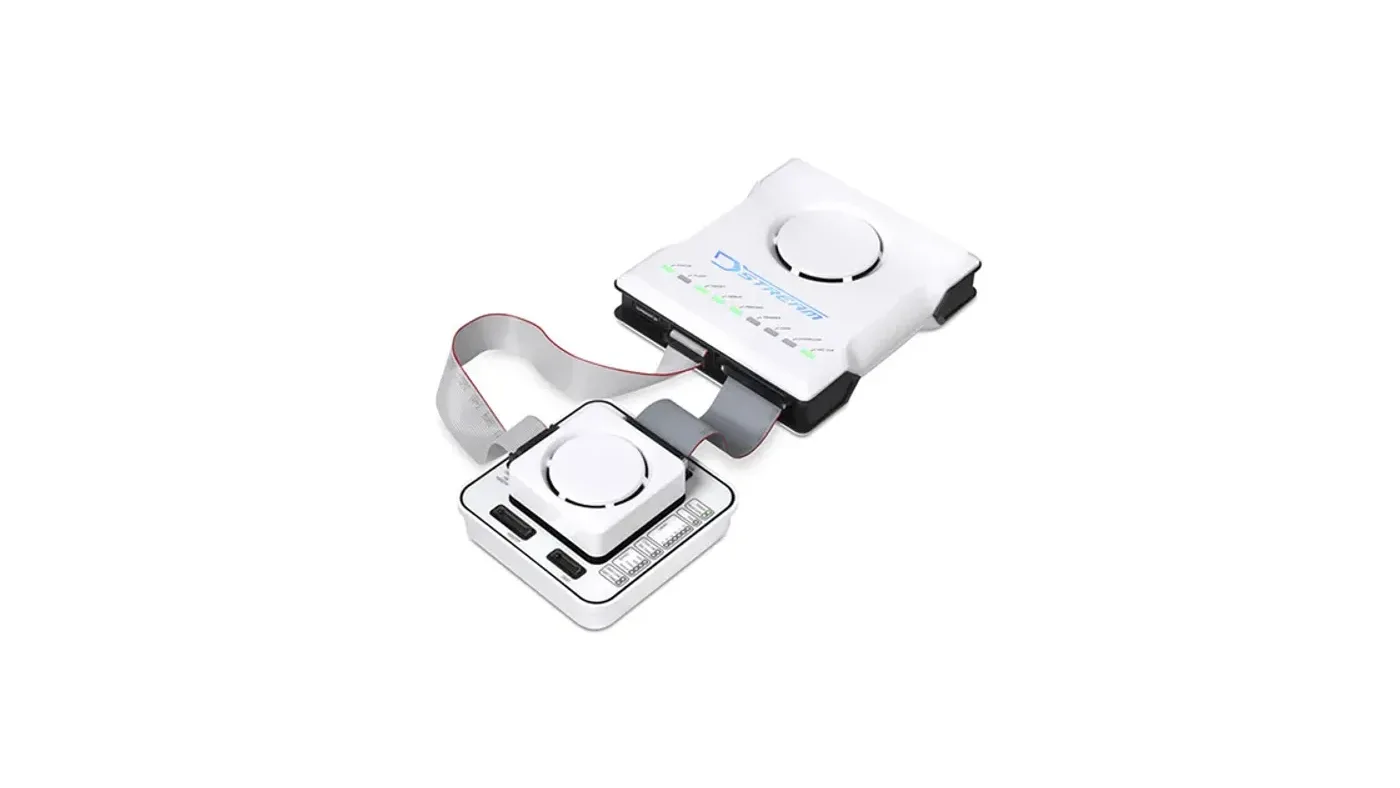
- Arm Cortex-R52 and other Cortex-R/A multicore devices: Arm Development Studio with DSTREAM-ST or DSTREAM-PT, or SEGGER J-Trace PRO Cortex-A/R with Ozone.
- AURIX and RH850: the Hitex UAD3+, whose GSAS product page lists AURIX and RH850 among its target MCUs. Our UAD3+ article and AURIX toolchain ecosystem post cover that route in detail.
For multicore AURIX/TriCore and RH850 trace, where the right setup depends on the exact device, its trace interface and the evidence your programme needs, talk to our FAE team about the right probe.
Where GSAS fits
GSAS Micro Systems supplies debug and trace tools from Arm, SEGGER and Hitex in India, with INR quotations and local application engineering. Our engineers in Bengaluru, Pune, Chennai and Hyderabad help automotive teams configure multicore run control, suspend behaviour and trace on real ECUs, and we support teams in Mumbai and Delhi NCR on site and remotely.
Related reading
- Choosing debug and trace tools for Indian automotive Tier-1s
- Non-intrusive debug of safety ECUs on production silicon
- UAD3+ multicore debug and trace
- Multi-core debug on i.MX RT1170, nRF5340 and RP2350
References
- Arm, Cortex-R52 Technical Reference Manual (cores, DCLS, ETMv4.2, CTI and CTM): https://documentation-service.arm.com/static/5ff2dd3f89a395015c28f8d4
- Linux kernel documentation, CoreSight tracing framework (cross-triggering): https://docs.kernel.org/trace/coresight/coresight.html
- Infineon, AURIX TC3xx Debug Support training (V1.0, 2020-06): https://www.infineon.com/dgdl/Infineon-AURIX_TC3xx_Debug_Support-Training-v01_00-EN.pdf?fileId=5546d46272e49d2a0172eb075eef736b
- Infineon, AURIX TC4xx Debug and Trace Support training (V1.0.0, 2024-09): https://www.infineon.com/dgdl/Infineon-AURIX_TC4x_Debug_and_Trace_Support_V1.0.pdf-Training-v01_00-EN.pdf?fileId=8ac78c8c97a5967c0197a8eef89a2a77
- Renesas, RH850/U2A zone and domain microcontroller series: https://www.renesas.com/products/microcontrollers-microprocessors/rh850-automotive-mcus/rh850u2a-zonedomain-microcontroller-series
- Renesas, RH850/E2UH: https://www.renesas.com/en/products/rh850-e2uh
- Renesas, On-chip Debuggers Performance Property: https://www.renesas.com/en/document/mat/chip-debuggers-performance-property?r=488801
Also appears in:
Building for Automotive & Mobility?
Talk to our application engineers for personalized tool recommendations.
More from Arm
View all →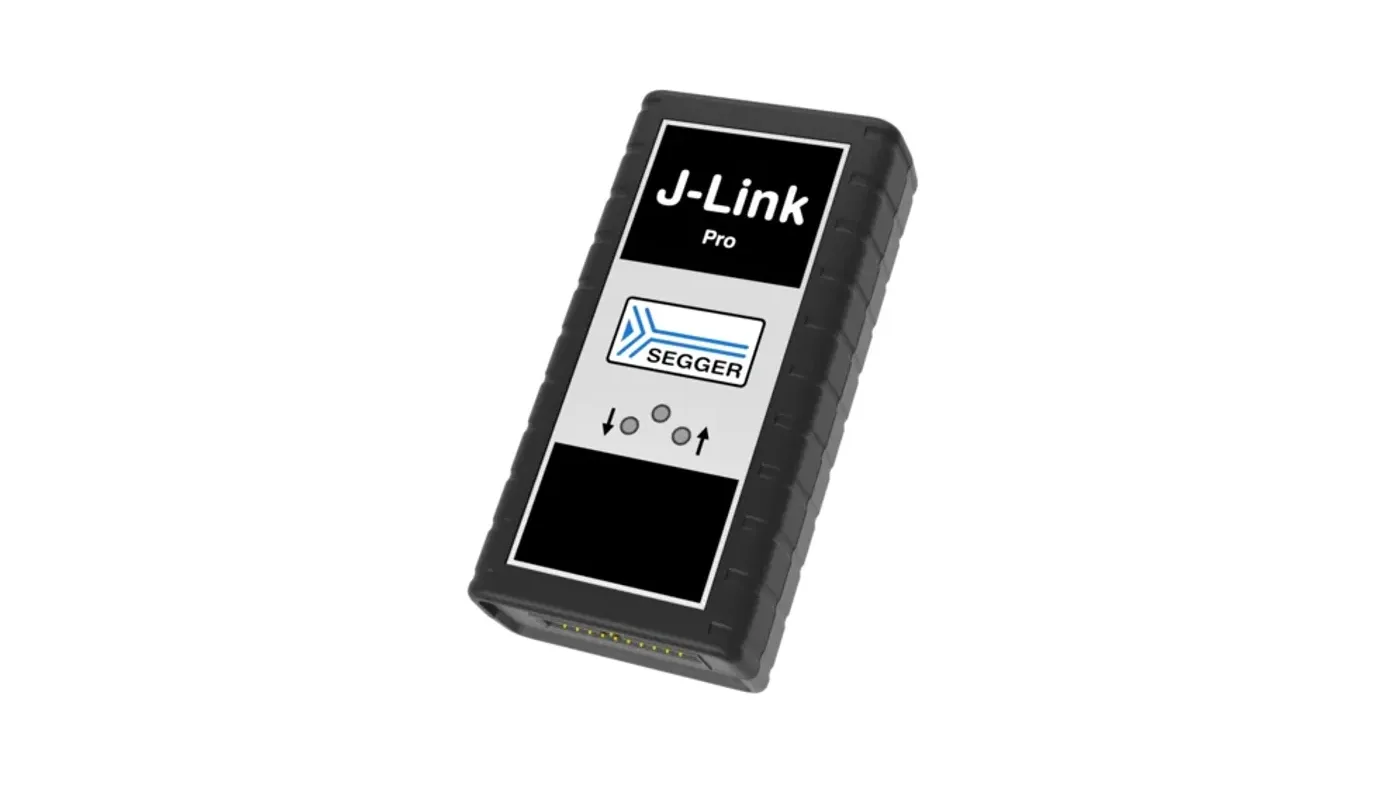
Choosing Debug and Trace Tools for Indian Automotive Tier-1s
13 Nov · 11 min
Non-Intrusive Debug of Safety ECUs on Production Silicon
13 Nov · 10 min
Off-Chip Trace Explained: ETM, Serial Trace, Trace Buffers
13 Nov · 10 min
Trace-Based Code Coverage as ISO 26262 and DO-178C Evidence
13 Nov · 11 min
Emulation vs FPGA Prototyping vs Simulation for SoC Teams
13 Nov · 8 min
GW Instek LCR-7000 and GPM-8340: New in India for 2026
13 Nov · 6 min