In short
There are three ways to get processor trace out of a chip. A parallel trace port carries trace from the ETM over a clock pin and several data pins to a trace probe. A high-speed serial trace port carries the same kind of data over a few differential lanes. An on-chip trace buffer stores trace in SRAM or system memory for a debugger to read later, which needs no extra pins but limits how much history you keep. The right choice depends on what the silicon implements, what the board can route, and how much execution history you need.
Every modern Arm core, and most automotive microcontrollers, can record what the processor executed. The hard part is not generating trace. It is getting trace off the chip fast enough, and for long enough, to answer the question you have.
There are three routes. Silicon vendors choose which ones a chip implements, and board designers choose which ones survive into the hardware. If a team in Bengaluru or Pune discovers on the bench that the route it needs was never routed, the fix is a board spin. This article explains the three routes in vendor-neutral terms, mostly using Arm CoreSight because its documentation is public, then gives a decision table.
Where trace comes from
On Arm cores, instruction trace comes from the Embedded Trace Macrocell (ETM). The ETM watches the core’s execution and emits a compressed stream describing program flow: which branches were taken, which exceptions occurred, and, when enabled, timestamps and cycle counts. It does not output every instruction. A debugger rebuilds the full instruction sequence by combining the stream with the program image, which is why trace decoding needs the exact ELF file that ran.
Some older Cortex-A cores use a closely related unit: Arm’s Cortex-A9 documentation calls it the Program Flow Trace Macrocell (PTM), based on the Program Flow Trace architecture. For selection purposes it plays the same role as the ETM.
Cortex-M devices add two more trace sources: the ITM (Instrumentation Trace Macrocell) for software-generated messages, and the DWT (Data Watchpoint and Trace) unit, which Arm’s Keil documentation describes as providing data trace, PC sampling and exception tracing. These are useful, low-cost signals, but they are not instruction trace.
In a multicore device each core typically has its own trace source. The Arm Cortex-R52 Technical Reference Manual, for example, states that each core has its own ETM implementing the ETMv4.2 architecture. Arm describes that trace as exported on trace buses that a CoreSight system can use to combine trace sources before a trace sink.
Route 1: the parallel trace port
The classic route. A Trace Port Interface Unit (TPIU) formats trace and drives it out on a trace clock pin and a set of trace data pins to a connector, where a trace probe captures it.
- Width. Arm’s TPIU supports data widths up to 32 bits. Each implementation decides which widths it supports, and the package decides how many pins are available. Arm’s TPIU-Lite, for example, supports 2, 4, 8, 16 and 32 bit ports. Your device reference manual is the authority.
- What it needs on the board. The trace pins routed to a trace connector, with attention to signal integrity on the trace clock and data lines. Trace pins are often multiplexed with other functions, so the pin budget has to be settled early.
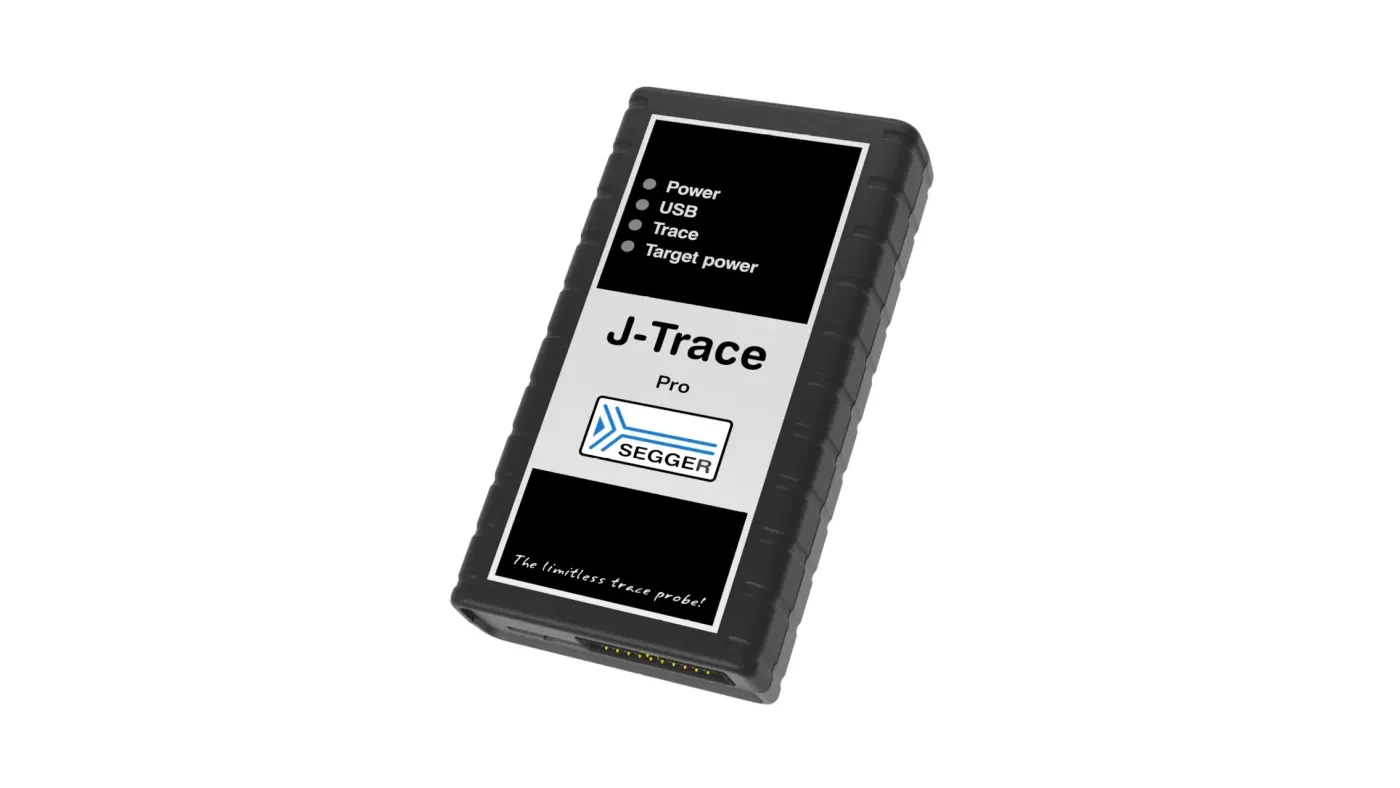
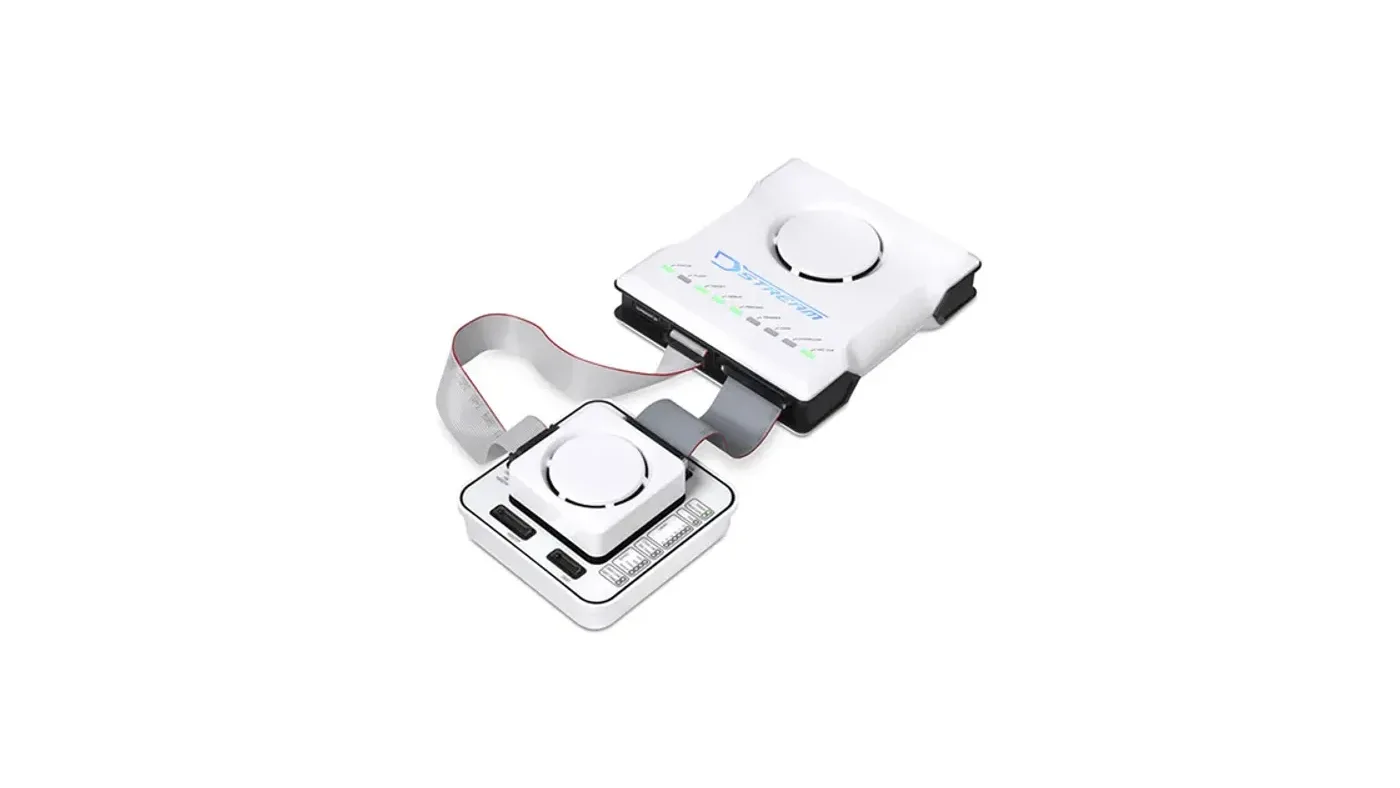
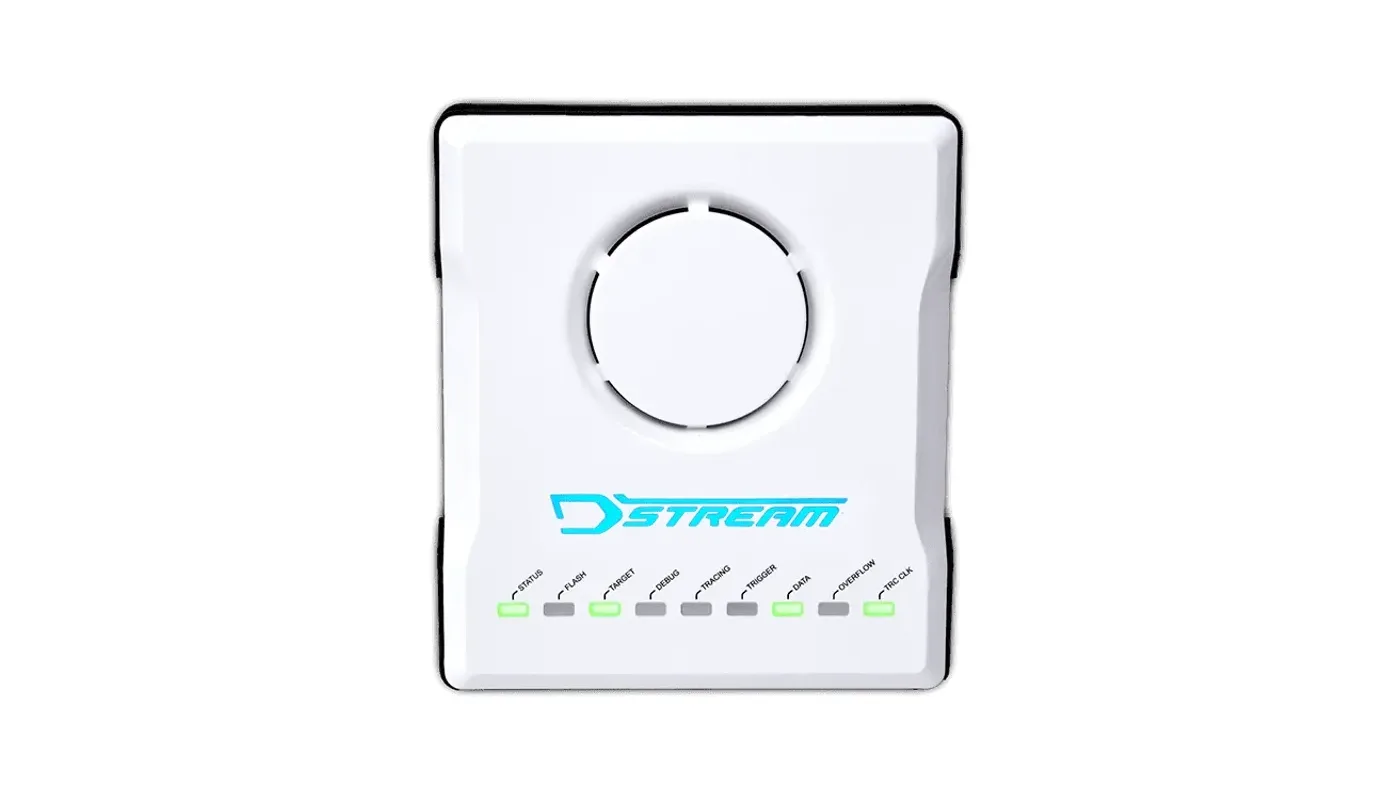
- What it gives you. Continuous trace for as long as the probe can store or stream it. Probes differ here. SEGGER J-Trace PRO and Arm’s DSTREAM-ST stream trace to the host computer; Arm’s announcement of DSTREAM-ST says it “does not contain any trace RAM” and streams all trace data to the host. Arm’s DSTREAM-PT captures up to 32 bits of parallel trace into an on-probe trace store.
Streaming and on-probe storage solve different problems. Streaming removes the depth limit, which matters for coverage across a whole test suite. A deep on-probe store with a wide port suits short, very high bandwidth captures. The J-Trace PRO streaming trace article goes deeper on the streaming side.
Route 2: high-speed serial trace
Parallel ports run out of pins and signal margin as trace bandwidth rises. Serial trace replaces the wide bus with one or more high-speed differential lanes.
Arm’s version is the High Speed Serial Trace Port (HSSTP). On its DSTREAM-HT product page Arm states that on a single two-pin lane HSSTP can transport trace data at rates comparable to a 16-pin parallel trace port. Other silicon vendors implement their own high-speed serial trace interfaces, and automotive multicore microcontrollers are a common place to find them.
- What it needs on the board. High-speed differential routing and the connector the probe expects, designed with the same care as any multi-gigabit link.
- What it needs from the probe. Support for that specific serial trace protocol and that specific device. Serial trace is less interchangeable than parallel trace.
- What it gives you. Far more trace bandwidth per pin, which matters for fast multicore devices where a parallel port would overflow.
Route 3: on-chip trace buffers
Some devices route no trace pins at all, or the production board has no room for a trace connector. On-chip buffers keep trace inside the chip for the debugger to read out over the normal debug connection.
Arm’s CoreSight Trace Memory Controller (TMC) is the common building block. Arm documents three configurations:
- ETB (Embedded Trace Buffer): trace stored in a dedicated SRAM used as a circular buffer.
- ETF (Embedded Trace FIFO): the SRAM acts as a FIFO in the trace path, smoothing bursts before trace goes to another sink.
- ETR (Embedded Trace Router): trace routed over the AXI bus to system memory, so a region of the device’s RAM becomes the trace buffer.
Small Cortex-M devices have a lighter option: the Micro Trace Buffer (MTB), which Arm’s Keil documentation describes for Cortex-M0+ and Cortex-M23 based devices. It records program flow into a region of on-chip SRAM.
On-chip buffers cost no pins, which is their strength. Their weakness is depth: you keep a window of recent execution, not a continuous record. That suits “what happened just before this fault”, and it does not suit coverage over an eight-hour regression.
Decision table
| Parallel trace port | High-speed serial trace | On-chip buffer (ETB, ETF, ETR, MTB) | SWO (Cortex-M) | |
|---|---|---|---|---|
| What leaves the chip | ETM or PTM program flow trace | ETM or vendor trace, serialised | Nothing until the debugger reads the buffer | ITM and DWT data, not instruction trace |
| Board cost | Trace clock plus data pins and a connector | Differential lanes and a high-speed connector | None beyond the debug connector | One pin |
| History you keep | Continuous while the probe streams or stores | Continuous while the probe streams or stores | A window sized by the buffer | Continuous, low bandwidth |
| Probe requirement | Trace probe supporting the port width | Probe supporting that serial protocol and device | Any probe whose debugger can read the buffer | Most debug probes |
| Best for | Coverage, timing, long captures on development boards | Fast multicore devices that overflow a parallel port | Fault forensics, field units, boards with no trace connector | Logging, sampling, first look at timing |
Three design rules that save a board spin
- Read the device’s debug and trace chapter before the schematic review, and write down which trace sinks the silicon implements. You cannot add a trace port the chip does not have.
- Route trace on development and test boards even if production will not have it. Coverage and timing evidence is collected on development hardware. The production-silicon side of the story is covered in non-intrusive debug of safety ECUs on production silicon.
- Plan for overflow. Any trace route can be overwhelmed by a fast core executing dense code. Trace filters, start and stop conditions, and cycle-accurate mode settings change how much data the ETM generates. Decide what you need to see before you decide how wide a port to route.
Where GSAS fits
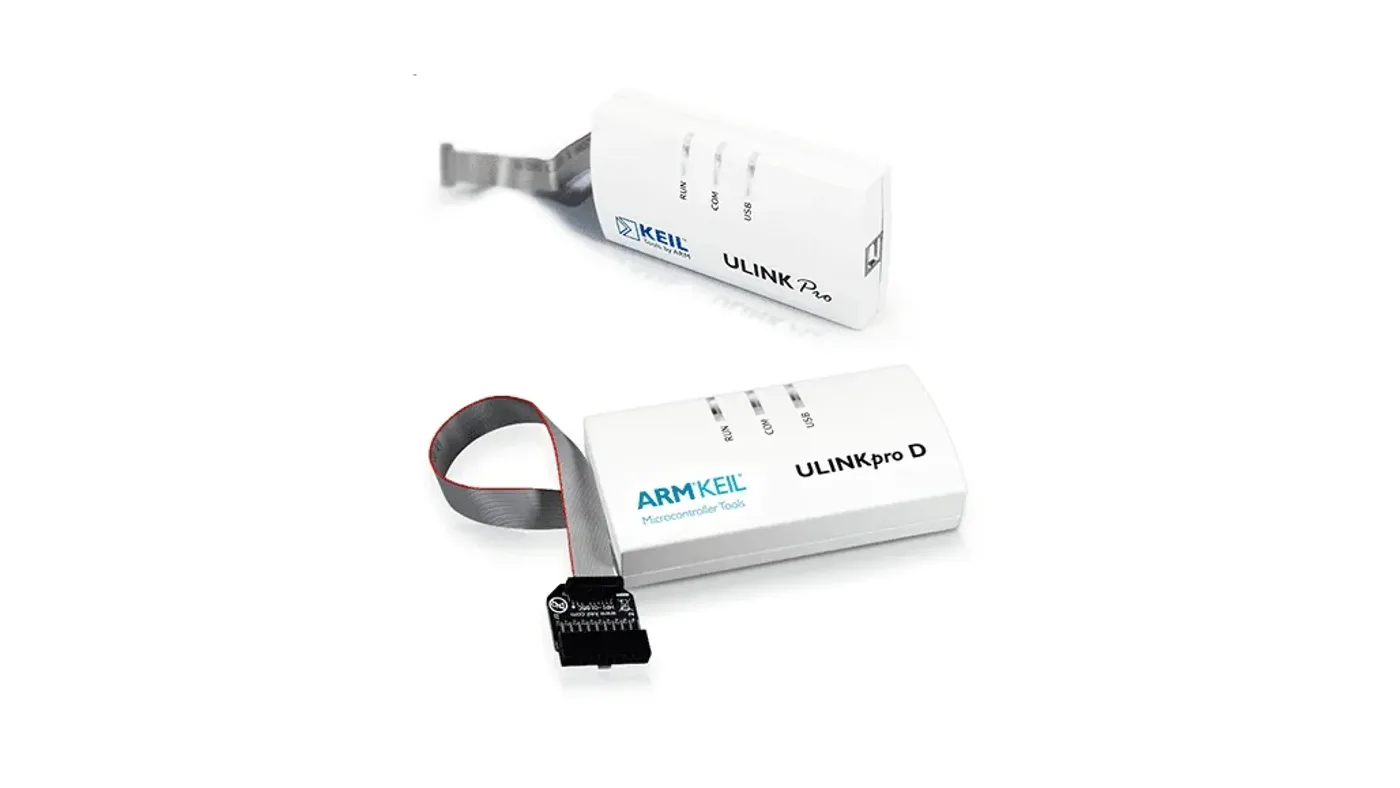
GSAS Micro Systems supplies trace probes and debuggers from SEGGER and Arm in India, including J-Trace PRO, DSTREAM-ST, DSTREAM-PT and ULINKpro, with Arm Development Studio for multicore Arm targets. Our application engineers in Bengaluru, Pune, Chennai and Hyderabad review trace routing on schematics and bring up trace on real boards.
For automotive multicore microcontrollers with their own serial trace interfaces, such as AURIX and RH850, talk to our FAE team about the right probe for your device and trace interface.
Related reading
- Choosing debug and trace tools for Indian automotive Tier-1s
- Multicore debug on AURIX, RH850 and Cortex-R52
- Timing analysis from trace for AUTOSAR ECUs
- Arm DSTREAM probes and Corstone reference subsystems
References
- Arm, CoreSight Trace Memory Controller (ETB, ETF and ETR configurations): https://www.arm.com/products/silicon-ip-system/coresight-debug-trace/coresight-tmc
- Arm, CoreSight TPIU-Lite Technical Reference Manual (supported port sizes): https://documentation-service.arm.com/static/5e8e2f8cfd977155116a7b0d
- Arm, CoreSight PTM-A9 Technical Reference Manual (Program Flow Trace): https://documentation-service.arm.com/static/5e8e3140fd977155116a81a9
- Arm, Cortex-R52 Technical Reference Manual (ETMv4.2, one ETM per core): https://documentation-service.arm.com/static/5ff2dd3f89a395015c28f8d4
- Arm, DSTREAM-HT product page (HSSTP): https://www.arm.com/products/development-tools/debug-probes/dstream-ht
- Arm, DSTREAM-PT product page: https://www.arm.com/products/development-tools/debug-probes/dstream-pt
- Arm Community, “Arm announces DSTREAM-ST”: https://developer.arm.com/community/arm-community-blogs/b/tools-software-ides-blog/posts/arm-announces-dstream-st
- Arm Keil, Micro Trace Buffer for Cortex-M0+ and Cortex-M23: https://www.keil.com/support/man/docs/dapdebug/dapdebug_cortex_m0+_m23_mtb.htm
- Arm, Keil Application Note KAN339 (Cortex-M trace sources): https://documentation-service.arm.com/static/61f93536fa8173727a1b72ab
- Linux kernel documentation, CoreSight tracing framework: https://docs.kernel.org/trace/coresight/coresight.html
Also appears in:
Building for Automotive & Mobility?
Talk to our application engineers for personalized tool recommendations.
More from Arm
View all →
Choosing Debug and Trace Tools for Indian Automotive Tier-1s
13 Nov · 11 min
Multicore Debug on AURIX, RH850 and Cortex-R52 in India
13 Nov · 11 min
Non-Intrusive Debug of Safety ECUs on Production Silicon
13 Nov · 10 min
Trace-Based Code Coverage as ISO 26262 and DO-178C Evidence
13 Nov · 11 min
Emulation vs FPGA Prototyping vs Simulation for SoC Teams
13 Nov · 8 min
GW Instek LCR-7000 and GPM-8340: New in India for 2026
13 Nov · 6 min