
 Arm
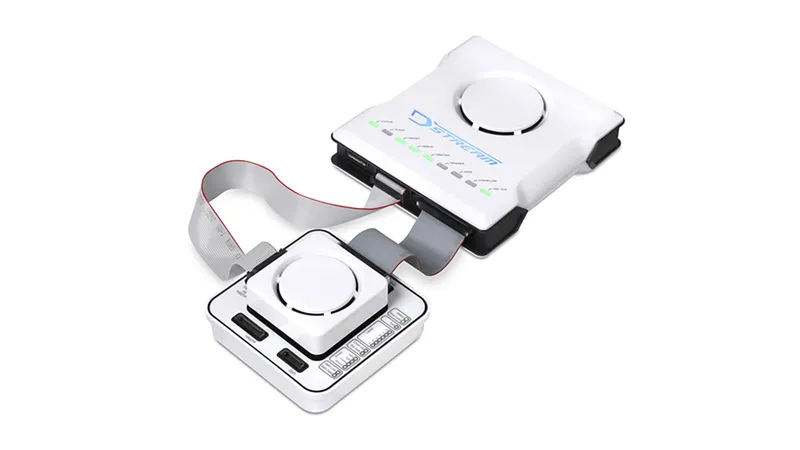
Arm DSTREAM-PT
Debug & TraceHigh-end parallel-trace debug probe for Cortex-A/R/M, TPIU capture up to 32-bit wide at up to 300 MHz DDR with on-probe buffering, JTAG/SWD/cJTAG run-control, and CoreSight support. India pricing and local support from GSAS.
Trace
Parallel TPIU, 4/8/16/32-bit
Trace capture
Up to 32-bit wide at up to 300 MHz DDR (600 Mbit/s per pin)
Bandwidth
Up to 19.2 Gbps captured
Architecture
Cortex-A, R, M
Interface
JTAG, SWD, cJTAG
Interface Vref
1.2 V to 3.3 V, configurable by target
CoreSight
ETM, PTM, ITM, STM
IDE
Arm Development Studio
Overview
About DSTREAM-PT
Quick Facts
- Trace
- Parallel TPIU, 4/8/16/32-bit
- Trace Capture
- Up to 32-bit wide at up to 300 MHz DDR (600 Mbit/s per pin)
- Bandwidth
- Up to 19.2 Gbps captured
- Architecture
- Cortex-A, R, M
- Interface
- JTAG, SWD, cJTAG
- IDE
- Arm Development Studio
The DSTREAM-PT is Arm’s high-end parallel-trace debug probe, providing non-intrusive hardware trace capture for Cortex-A, Cortex-R, and Cortex-M based SoCs. It connects to the target’s Trace Port Interface Unit (TPIU) and captures ETM trace data at up to 32-bit parallel width, at up to 300 MHz DDR or 600 Mbit/s per pin, delivering up to 19.2 Gbps of captured trace bandwidth. Run-control debugging is supported via JTAG, SWD, and cJTAG interfaces, covering the full range of Arm-based targets from single-core microcontrollers to multi-core application processors.
Parallel trace capture enables code coverage analysis, execution profiling, and post-mortem crash diagnosis without halting or slowing the target processor. The captured trace stream provides a cycle-accurate record of executed instructions, which supports structural coverage evidence in safety-critical projects governed by ISO 26262 and IEC 61508. For DO-178C (aerospace) programmes, coverage evidence comes from a separately qualified analysis tool that consumes DSTREAM-PT trace data; DSTREAM-PT itself and Arm’s AC6 FuSa qualification do not cover DO-178C.
DSTREAM Probe Comparison
| Feature | DSTREAM-PT | DSTREAM-ST |
|---|---|---|
| Trace Method | Parallel TPIU, capture into on-probe buffer | 4-bit parallel, streamed to host |
| Trace Port Width | 4/8/16/32-bit TPIU | 4-bit TPIU |
| Trace clock | Up to 300 MHz DDR (600 Mbit/s per pin) | Up to 300 MHz DDR (600 Mbit/s per pin) |
| Trace Bandwidth | Up to 19.2 Gbps captured | Up to 2.4 Gbps streamed |
| Run-Control | JTAG, SWD, cJTAG | JTAG, SWD, cJTAG |
| Target Architecture | Cortex-A, R, M | Cortex-A, R, M |
| Host IDE | Arm Development Studio | Arm Development Studio |
DSTREAM-PT works with Arm Development Studio (Gold edition), providing integrated debug and trace analysis from a single toolchain. Because capture lands in the probe rather than streaming straight out, a port up to 32-bit wide running at up to 300 MHz DDR does not have to fit through the host link in real time. That is what matters when the target emits trace faster than USB can carry it. For 4-bit TPIU targets where capture length matters more than peak bandwidth, the DSTREAM-ST streams directly to the host. GSAS Micro Systems stocks DSTREAM-PT units in India with manufacturer warranty and provides evaluation support, probe configuration, and training on trace-based debug workflows.
Blog
Arm Insights

Meet the GSAS Team at electronica India 2026, Stall H3.I45
electronica India 2026 opens on 16 September at BIEC Bengaluru. The GSAS team is on the floor all three days at Stall H3.I45, and this is who you will be talking to and what they can show you.
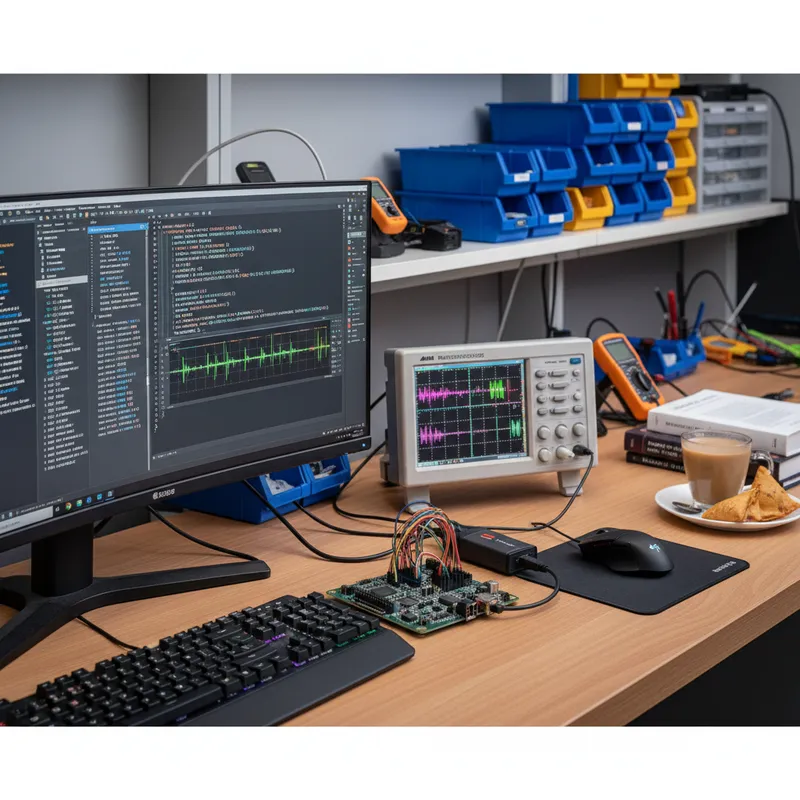
Arm's Agentic AI Push: What Indian Embedded Teams Can Actually Use Today
Arm has set out its platform strategy for the agentic era, putting inference everywhere it has compute. Indian embedded teams can start on that direction this quarter with the Cortex-M toolchain they already own: Helium, CMSIS-NN, Ethos-U and Vela, on boards you can order today.
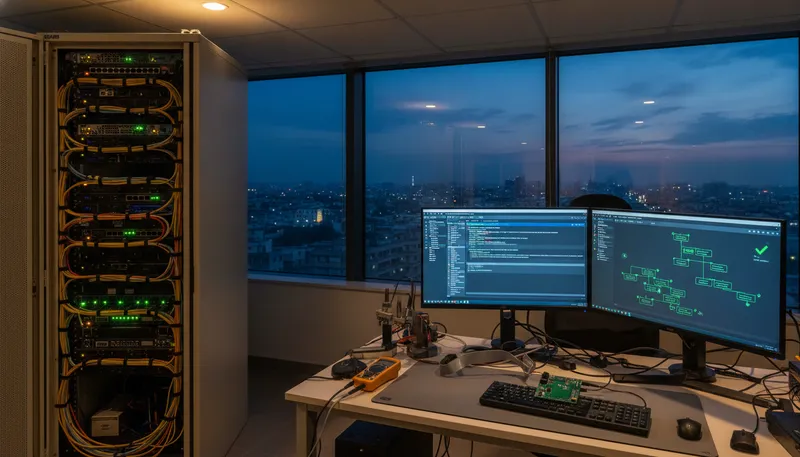
Arm User-Based Licensing in CI/CD: armlm, Proxy Activation and What Breaks
A licensing failure in an Arm pipeline blocks the release branch and puts a firmware engineer on armlm output instead of driver code, up to seven days after the change that caused it. The reason: a UBL licence is a cached certificate valid for 7 days, not a checkout. Here is what that changes about pipeline design, and what to fix first.
Related products
More from Arm
All Arm products →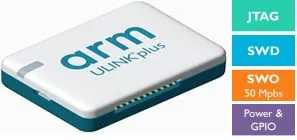
ULINKplus
Advanced debug adapter with power measurement, test I/O, and SWV trace for Arm Cortex-M development and testing. Available in India from GSAS with hands-on application engineering and local support.
View ULINKplus →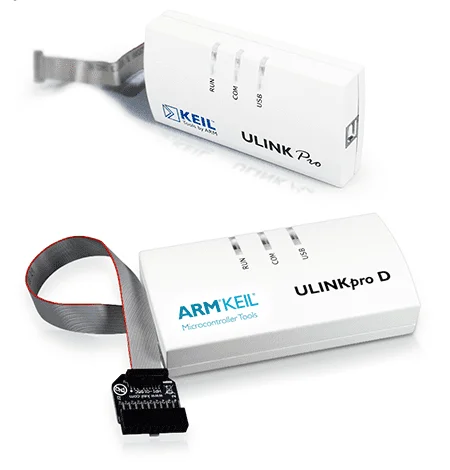
ULINKpro
High-speed debug and trace probe with ETM streaming trace and code-coverage support for Arm Cortex-M, JTAG up to 50 MHz, SWV up to 100 Mbit/s (Manchester), ETM up to 800 Mbit/s, memory R/W up to 1 MB/s, per Arm's published ULINKpro specifications. Local stock and support across India, GSAS.
View ULINKpro →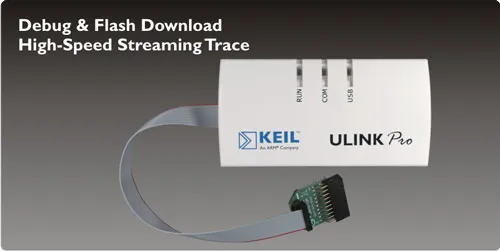
ULINKpro D
Debug variant of ULINKpro for Cortex-M, JTAG up to 50 MHz, SWV up to 100 Mbit/s (Manchester), memory R/W up to 1 MB/s, per Arm's published Keil ULINKpro specifications. No ETM trace (use ULINKpro for ETM). India pricing and local support from GSAS.
View ULINKpro D →FAQ
Common questions about DSTREAM-PT
DSTREAM-ST vs DSTREAM-PT?
Does DSTREAM-ST have an on-probe buffer?
Is DSTREAM-XT a real Arm product?
Which DSTREAM for high-bandwidth parallel trace?
Interested in DSTREAM-PT?
Get pricing, an evaluation unit, or a technical consultation from our application engineers.