UAD3+ Debug Probe: 4 GB Trace Memory, 8 Cores, and 500 MHz Serial Trace for AURIX and Cortex-R/M
Debugging a single-core Cortex-M4 is straightforward. Debugging a six-core Infineon AURIX TC399 running three independent safety applications, a communication stack, and an AUTOSAR OS, while capturing execution traces deep enough to diagnose timing races that occur once per million cycles, is an entirely different engineering problem.
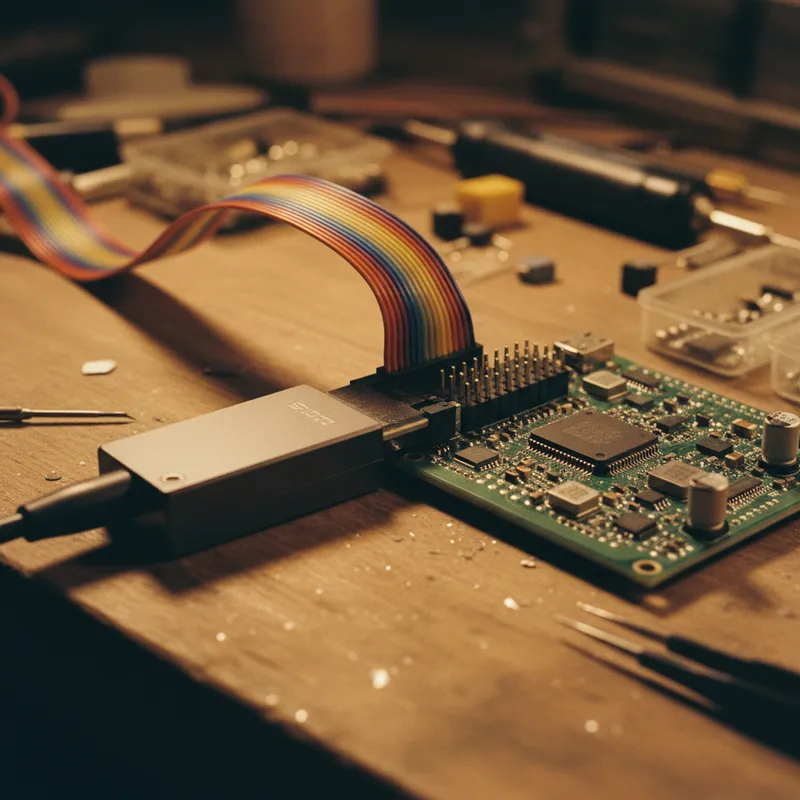
The UAD3+ (Universal Access Device 3+) from PLS/Hitex is a professional multi-core debug and trace probe built for exactly this class of problem. It provides simultaneous access to up to 8 cores, 4 GB of onboard trace memory, and 500 MHz / 3.125 Gbit/s serial trace bandwidth, enough to capture continuous execution traces on modern automotive and industrial MCUs without the buffer overruns and data gaps that make smaller probes unreliable for production-level debugging.
Why Trace Depth Matters
Standard debug probes offer stop-mode debugging: set a breakpoint, halt the processor, inspect registers and memory. This works for logic errors in isolated functions. It does not work for timing-dependent bugs in multi-core systems, race conditions, priority inversions, missed deadlines, interrupt latency spikes.
Trace capture solves this by recording the processor’s execution history in real time, without stopping the target. But trace is only useful if the buffer is deep enough. A probe with 256 MB of trace memory fills up in milliseconds on a high-frequency MCU. The UAD3+ provides 4 GB, enough to capture seconds of continuous execution on a 300 MHz TriCore, or to use triggering and filtering to capture hours of selective trace data.
For automotive teams debugging AURIX-based ECUs, this depth means you can trace the entire startup sequence, capture the behavior across a complete CAN/LIN communication cycle, or record the execution pattern around an intermittent fault that takes hours to reproduce.
Multi-Core Simultaneous Debug
The UAD3+ connects to up to 8 cores simultaneously through a single debug connector. On an AURIX TC3xx with 3 to 6 TriCore CPUs, the UAD3+ can halt, step, and inspect all cores at once, or independently. Cross-core breakpoints allow you to halt all cores when a condition occurs on one, which is essential for debugging shared-memory interactions.
The supported architectures span the major automotive and industrial MCU families:
- Infineon AURIX TC3xx / TC2xx: full TriCore OCDS Level 2 debug + MCDS trace
- Arm Cortex-R, Cortex-M, Cortex-A: CoreSight DAP access, ETM trace
- Renesas RH850: Nexus debug and trace interface
- Power Architecture: NXP and STMicro automotive MCUs
This breadth matters for Indian engineering teams that work across multiple MCU platforms. A single UAD3+ probe can serve the AURIX powertrain project, the Cortex-R ADAS project, and the RH850 body electronics project, reducing hardware investment and training overhead.
Debug Interfaces and Bandwidth
The UAD3+ supports JTAG (up to 100 MHz), compact JTAG (cJTAG), DAP/DAP2, and SWD debug interfaces. For trace, it supports Aurora (AURIX high-speed serial trace), CoreSight ETM (Arm), Nexus (RH850), and OCDS Level 2 (TriCore parallel trace).
The serial trace interface operates at 500 MHz clock / 3.125 Gbit/s data rate, which is the maximum bandwidth supported by the Aurora interface on AURIX TC3xx. This means the UAD3+ captures trace data at full target speed, no data compression artifacts, no dropped cycles, no reconstruction errors.
An optional 1,000V electrical isolation module is available for applications where the debug probe must be galvanically isolated from the target, common in high-voltage EV powertrain debugging.
UDE: Universal Debug Engine
The UAD3+ pairs with UDE (Universal Debug Engine), a professional debug IDE developed by PLS. UDE provides:
Multi-core visualization. Each core gets its own debug view, source code, disassembly, registers, memory, with synchronized stepping and cross-core data inspection. For AURIX debugging, UDE understands the TriCore architecture natively: peripheral registers, trap vectors, safety management unit (SMU) status.
RTOS-aware debugging. UDE provides task-level views for FreeRTOS, PXROS, SafeRTOS, and AUTOSAR OS. Engineers see task states, stack usage, semaphore ownership, and scheduling history, not just raw register values.
Trace analysis. The 4 GB trace buffer is analyzed in UDE with execution profiling, function call graphs, code coverage heat maps, and timeline views that show multi-core execution interleaving. This is where the deep trace buffer pays off: the analysis has enough data to show statistical execution patterns, not just single-shot captures.
In-system flash programming. UDE programs target flash memory directly through the debug interface, no separate programming hardware required. This includes AURIX PFLASH and DFLASH, as well as external QSPI flash connected to the MCU.
Test automation. UDE supports scripted command-line execution for automated regression testing. Test sequences can be triggered from CI/CD pipelines, recording pass/fail results alongside trace captures for post-mortem analysis.
Why Buy from GSAS
GSAS Micro Systems provides PLS/Hitex debug tools in India with INR invoicing, evaluation units, and application engineering support. For automotive teams in Bengaluru and Pune debugging AURIX-based ECUs, aerospace teams in Hyderabad and Chennai working on multi-core safety systems, or industrial teams in Mumbai and Delhi NCR developing safety PLC platforms, GSAS provides the UAD3+ hardware, UDE licensing, and hands-on integration support to get your multi-core debug environment productive from day one.
Also appears in:
Interested in Hitex tools?
Talk to our application engineers for personalized tool recommendations.
More from Hitex
View all →
The AURIX Toolchain Ecosystem in India: TESSY + SafeTpack + UAD3+/UDE for Complete Development
6 Apr · 6 min
SafeTpack for Infineon AURIX TC3xx: LBIST, Program Flow Monitoring, and ASIL D Self-Test
6 Apr · 4 min
Hitex SafeTpal vs In-House Self-Test for AURIX: Choosing the Right Safety Test Strategy
2 Apr · 6 min

Emulating Processor Power for Thermal Testing: Why Constant Power
7 Oct · 7 min

CRPS and Rack Power Supply Testing: The Six Tests That Matter
7 Oct · 7 min
GPU Power Board Testing: DC Input Verification Before Integration
7 Oct · 6 min