
 SEGGER
 Ozone
Compilers & IDEsCross-platform debugger and performance analyzer with source/assembly debug, timeline visualization, power profiling, and code coverage. Free with J-Link. India pricing and local support from GSAS.
Debug
Source + assembly level
Timeline
Real-time execution timeline
Power
Power profiling
Coverage
Code coverage analysis
Hardware
Works with J-Link
License
Free with J-Link
Overview
About Ozone
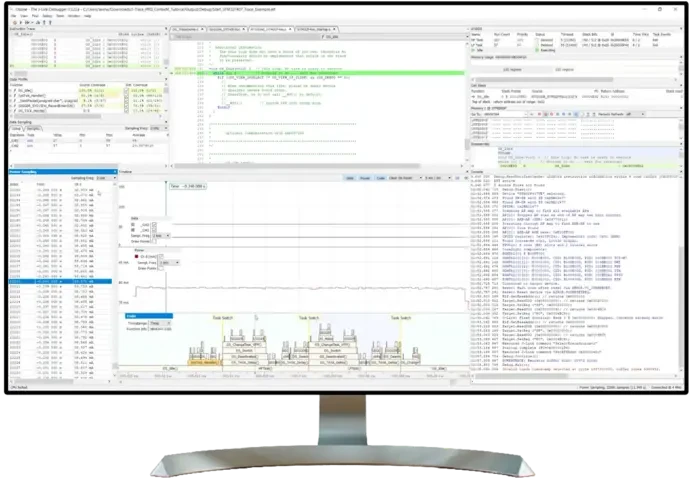
SEGGER Ozone is a standalone cross-platform debugger and performance analyzer that provides deep visibility into embedded application behavior beyond what IDE-integrated debuggers typically offer. Purpose-built for J-Link debug probes, Ozone delivers source-level and assembly-level debugging alongside advanced analysis features, all in a single tool that runs on Windows, macOS, and Linux.
Key Features
| Feature | Description |
|---|---|
| Source-Level Debug | Step through C/C++ source with full variable inspection, watch expressions, and call stack |
| Assembly Debug | Instruction-level stepping with register view and memory dump |
| Execution Timeline | Real-time visualization of task execution, ISR activity, and idle periods |
| Power Profiling | Correlate code execution with power consumption measurements via J-Link |
| Code Coverage | Statement, branch, and MC/DC coverage metrics for safety certification |
| Data Trace | Monitor variable values over time without halting the target |
| Scripting | JavaScript-based automation for repeatable debug sessions and regression testing |
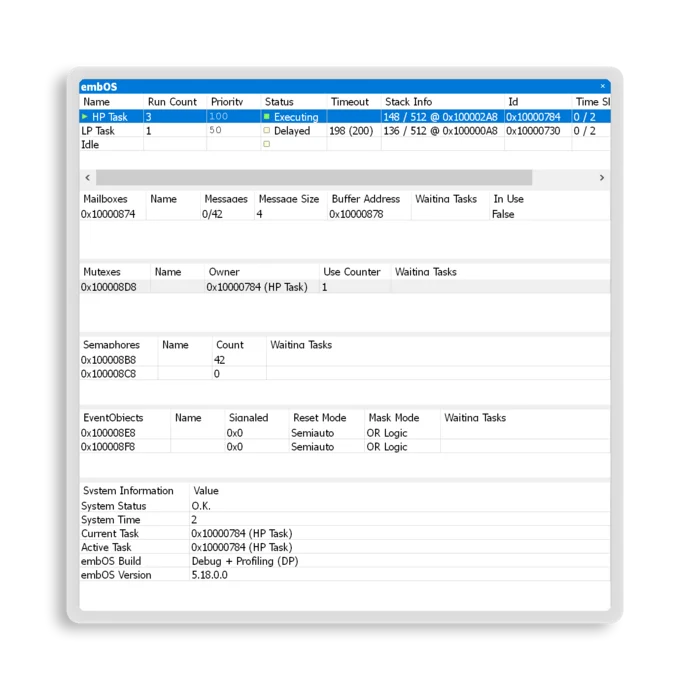
| RTOS Awareness | Task lists, stack usage, resource views for embOS, FreeRTOS, and others |
| Multi-Core | Debug multiple cores simultaneously with synchronized views |
| Console / Terminal | Integrated RTT terminal for printf-style debug output |
| ELF/DWARF Parsing | Direct loading of ELF files, no IDE project required |
| Cross-Platform | Native builds for Windows, macOS, and Linux |
Timeline and Profiling
The execution timeline view transforms debugging from a point-in-time breakpoint exercise into a continuous behavioral analysis. Developers can see exactly when tasks execute, how long ISRs take, where idle time accumulates, and how power consumption correlates with code execution patterns. This visibility is essential for optimizing battery life in IoT devices, meeting real-time deadlines in control systems, and diagnosing intermittent timing bugs that are invisible with traditional breakpoint debugging.
Hardware-free debugging with Ozone-Sim
Ozone can also debug and analyze firmware with no target hardware at all, using Ozone-Sim, SEGGER’s instruction set simulator for Arm and RISC-V. Ozone-Sim runs inside Ozone as a selectable target interface, so the same source-level debugging, profiling, and coverage views work whether the firmware is running on a J-Link-connected board or in simulation on a PC, with no J-Link required.
Code Coverage for Safety Certification
Watch the SEGGER Ozone introduction
Ozone is free for use with any J-Link debug probe, making it an immediate upgrade for teams already invested in the SEGGER debug ecosystem. Code coverage analysis identifies untested code paths, critical for safety-certified development under DO-178C, IEC 62304, and ISO 26262 where coverage metrics are mandatory deliverables. The combination of Ozone’s analysis capabilities with J-Link’s trace hardware creates a comprehensive debug and profiling environment at no additional software cost.
Blog
SEGGER Insights
Ozone-Sim: SEGGER's Hardware-Free Embedded Simulator for Arm and RISC-V
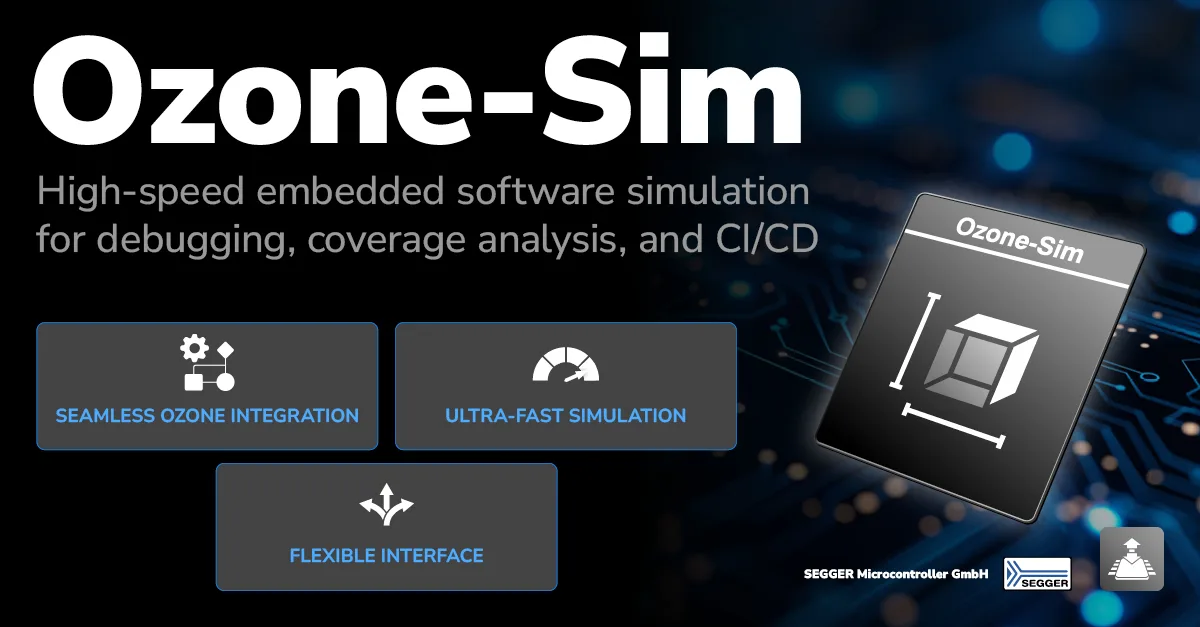
SEGGER's new Ozone-Sim instruction set simulator runs Arm and RISC-V firmware on a PC at hundreds of millions of instructions per second (up to 700 million on an AMD Ryzen 9, per SEGGER), no J-Link and no target board required. Here is how it works with Ozone, how it plugs into CI/CD, and how to evaluate it in India with GSAS.
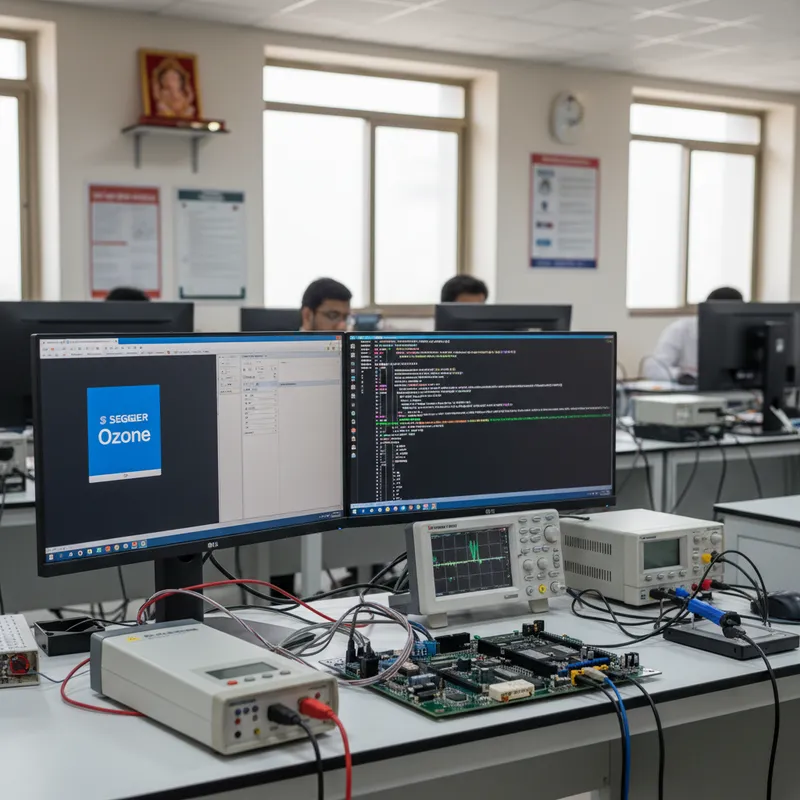
SEGGER Ozone Lua Scripting for Indian Advanced Debug and Test Automation Workflows
Ozone's built-in Lua scripting engine turns the standalone graphical debugger into a test automation platform for Indian bring-up, soak testing, and IEC 62304 evidence capture.
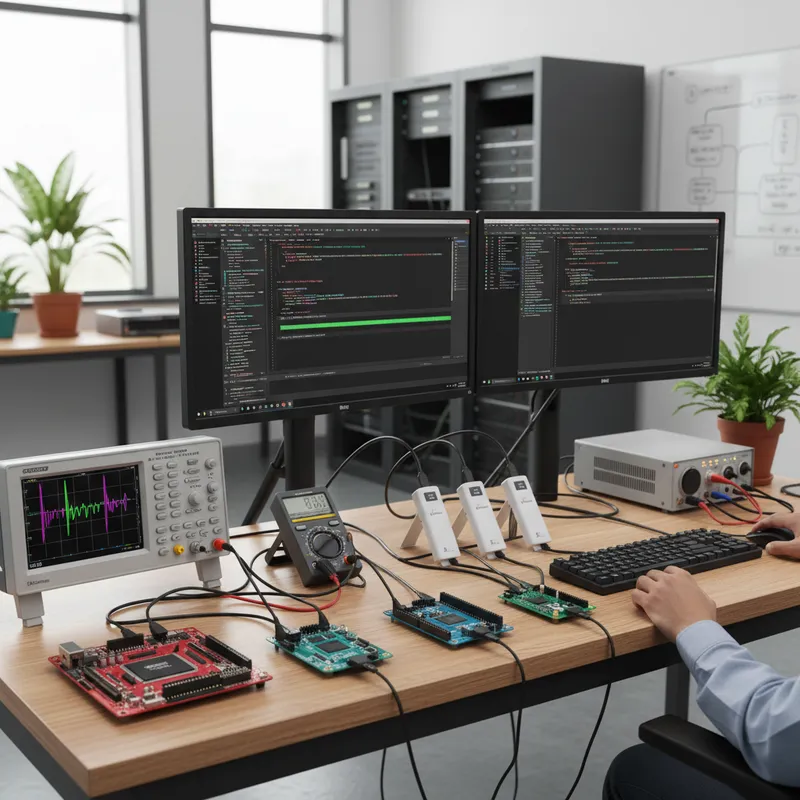
Multi-Core Debug on i.MX RT1170, nRF5340, and RP2350 with SEGGER J-Link and Ozone
Dual-core is the new normal. Indian consumer electronics, automotive, and medical-device teams building on NXP i.MX RT1170, Nordic nRF5340, and Raspberry Pi RP2350 face debug challenges no single-core tutorial covers. Here's the J-Link and Ozone workflow that turns multi-core debug from a days-long nightmare into a morning.
Related products
More from SEGGER
All SEGGER products →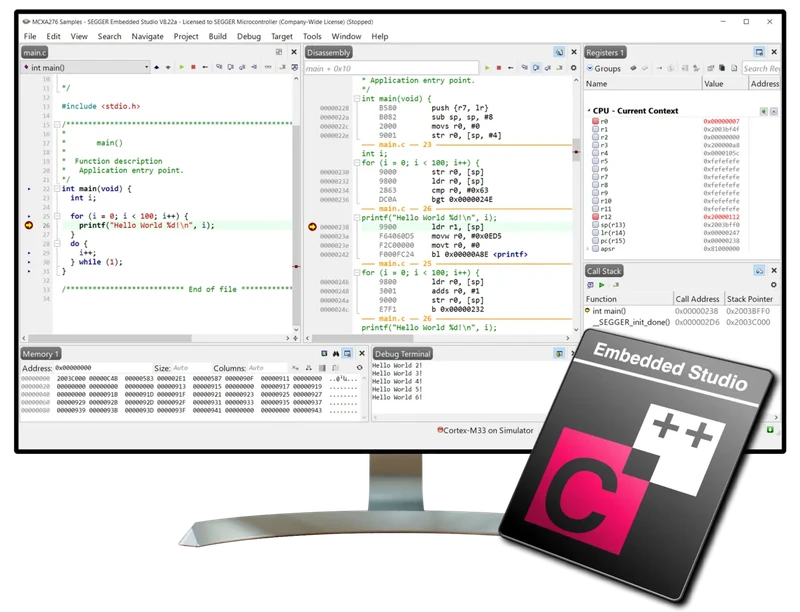
Embedded Studio
Cross-platform IDE for Arm and RISC-V with integrated GCC, Clang/LLVM compilers and SystemView analysis. Local stock and support across India, GSAS.
View Embedded Studio →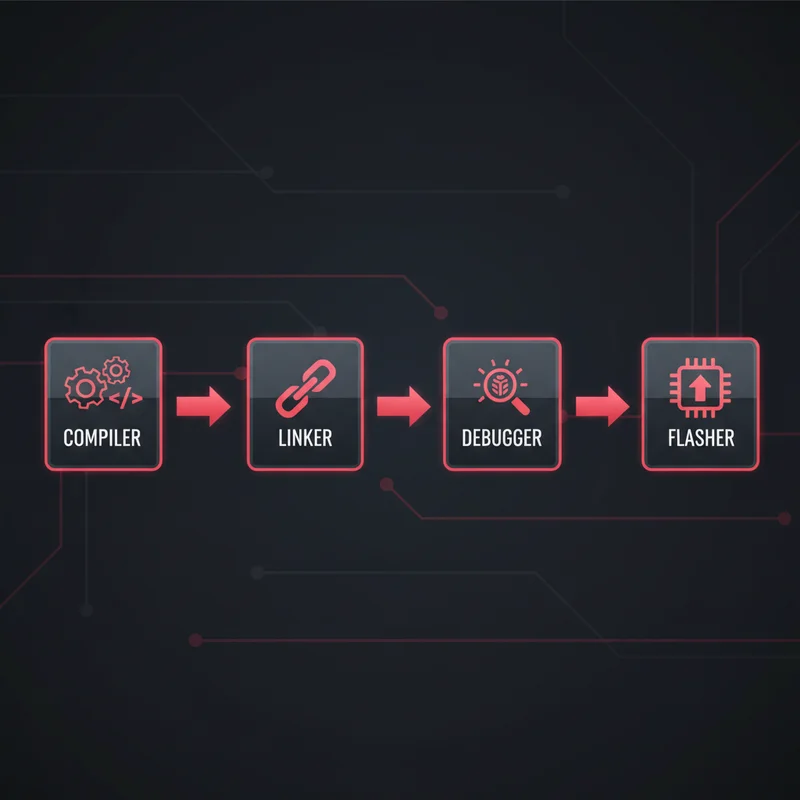
SEGGER Toolchain
Optimising C/C++ compiler and linker for Arm and RISC-V with compact code density, STOP stack protection, and up to 5.8x faster link times. Available in India from GSAS.
View SEGGER Toolchain →
emRun / emRun++ / emFloat
High-performance C/C++ runtime and floating-point libraries for Arm and RISC-V, delivering up to 4x smaller footprint and 4x faster execution than newlib. Available in India from GSAS.
View emRun / emRun++ / emFloat →FAQ
Common questions about Ozone
What is the difference between Ozone and Ozone-Sim?
Can Ozone debug without any hardware?
Is Ozone free to use?
Which architectures does Ozone support?
Which operating systems does Ozone run on?
Interested in Ozone?
Get pricing, an evaluation unit, or a technical consultation from our application engineers.