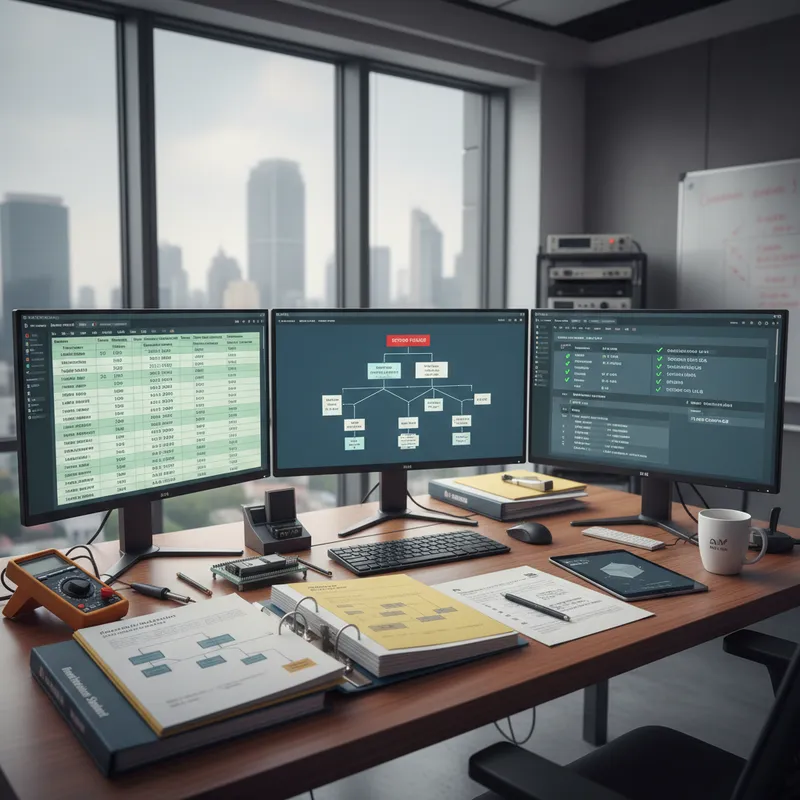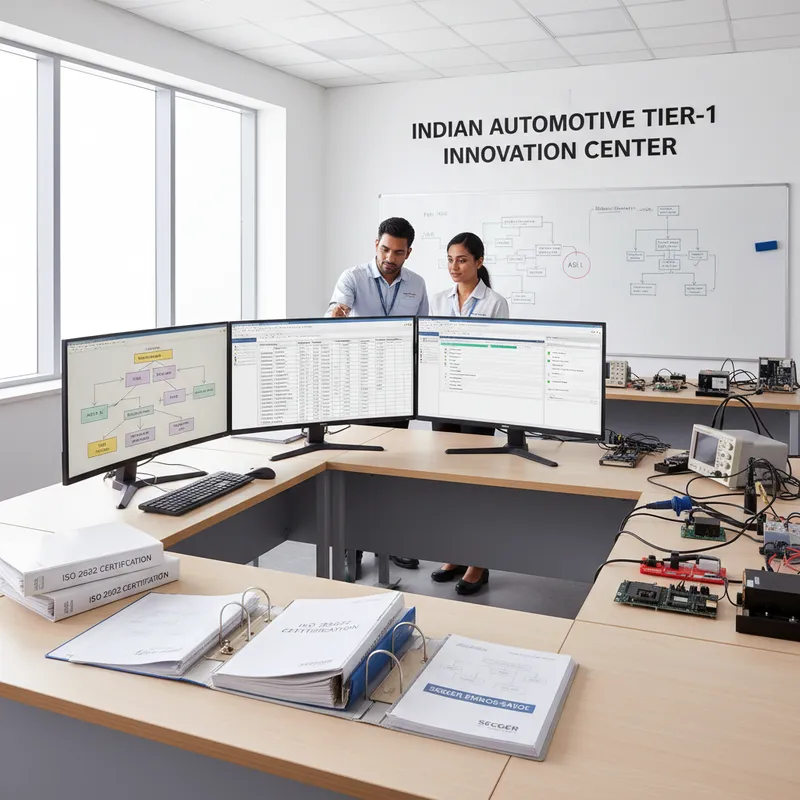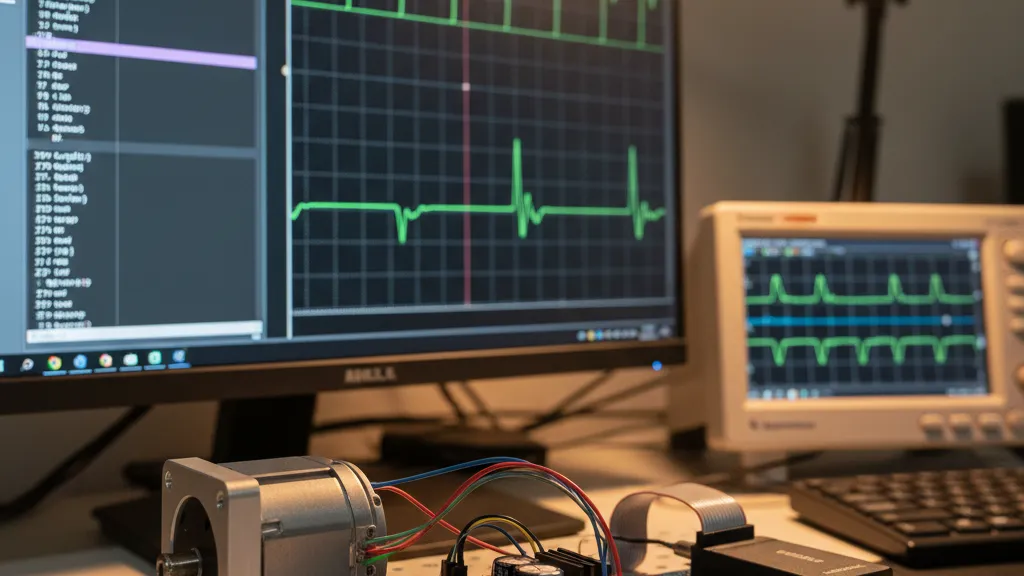
Halt-mode debugging is the default for a reason: you hit a breakpoint, the entire CPU stops, you inspect, you step. For most embedded firmware, that’s exactly what you want. For motor control, DC-DC converters, power-factor-correction loops, brushless gimbal stabilisation, or any code that drives a closed-loop hardware peripheral at high frequency, it’s catastrophic.
The instant the CPU halts, the PWM peripheral stops being serviced. The PWM lines either freeze in their last state or, depending on how the silicon handles a halted core, glitch in unpredictable ways. On a BLDC motor, that’s a stalled rotor, locked windings, and a current spike. On a buck converter, that’s a stuck duty cycle and a fried inductor or output capacitor. On a battery management system, that’s a contactor in the wrong state for half a second longer than the safety case allows.
SEGGER’s Monitor Mode debugging is the standard answer. The CPU foreground halts. A small high-priority interrupt handler keeps the time-critical peripherals serviced. The debugger sees a stopped target. The motor keeps spinning.
This post is the engineering brief: how monitor mode actually works, what Cortex-M variants support it, where it falls down, and the workflow GSAS uses with power-electronics teams across Bengaluru, Pune, Chennai, and Hyderabad.
What monitor mode actually does
The trick is in the Cortex-M debug architecture. The core supports two halt modes:
- Halt mode (default): debug breakpoint fires, the entire CPU stops. All interrupts pend but don’t service. The target is frozen.
- Monitor mode: debug breakpoint fires, but instead of halting the core, it triggers a DebugMon exception. The CPU enters the DebugMon handler, which behaves like any other ISR.
When you configure J-Link for monitor mode, the DebugMon handler does the equivalent work of the halt-mode debug stub: it talks to the J-Link over SWD/JTAG, dumps registers, accepts memory reads/writes, services step/run/continue commands. The handler runs at a priority you choose, typically lower than your motor-control PWM ISR and timer interrupts, higher than the application background.
The practical effect: your motor-control ISR keeps firing at 20 kHz (or 50 kHz, or 100 kHz, whatever your loop rate is). PWM keeps modulating. Closed-loop current control keeps regulating. Meanwhile, your application code is sitting in the DebugMon handler waiting for you to finish inspecting variables and step or continue.
The peripheral hardware never knows the foreground is stopped. From the motor’s perspective, nothing has changed.
Which cores support it
SEGGER’s monitor mode is Cortex-M only: specifically Cortex-M3, M4, M7, M23, M33, M55, and M85. Cortex-M0 and M0+ do not have the DebugMon exception, so monitor mode is not available. You’re stuck with halt mode on those parts. Cortex-A, Cortex-R, and RISC-V use different debug architectures with their own halt-vs-monitor stories, SEGGER documents those separately.
The covered Cortex-M variants represent essentially every modern motor-control and power-electronics MCU in active design across Indian Tier-1 supplier benches today: ST’s STM32 G4 / F4 / H7 / G0, NXP’s S32K1 and Kinetis V, Microchip / Atmel SAM, Renesas RA / RX (RX uses its own monitor variant), TI’s C2000 (different arch, separate story), Nordic nRF52 (M4), and the Cortex-M0+ family that’s not covered (STM32 G0 in some variants, nRF52810, RP2040).
If your motor control runs on a Cortex-M0/M0+, you don’t get monitor mode, you stop the motor every time you debug. That’s a real product-line consideration when picking silicon for a motor program.
When to reach for it
Three concrete scenarios from the bench:
1. Brushless motor (BLDC) bring-up. Your motor-control ISR runs FOC at 20 kHz off a centre-aligned PWM. A bug in your speed regulator is causing torque ripple. You want to set a breakpoint inside the speed loop, inspect the integrator state, step through one iteration, then continue. In halt mode, the rotor freewheels the moment you hit the breakpoint, and on the way back the FOC has stale state. In monitor mode, the PWM keeps modulating with the last committed duty cycle while you inspect, then the loop resumes when you continue.
2. Buck-boost or PFC converter dev. Your switching loop runs at 100 kHz with current-mode control. You suspect the inductor-current regulator is saturating in transients. Halt mode means a stuck switch, depending on where in the cycle you hit the breakpoint, the inductor either dumps its energy or stays charged. Either way, the load sees something it shouldn’t. Monitor mode keeps the regulator running while you inspect the duty-cycle command path.
3. Battery management / contactor sequencing. A BMS state machine runs precharge → contactor close → balance with strict timing relationships between contactor command and pack-voltage measurement. A breakpoint in the wrong state can leave the contactor open when it should be closed (loss of pack voltage at the load) or closed when it should be open (in-rush event on a precharge fail). Monitor mode keeps the contactor-management ISR running.
In all three: the rule of thumb is “if the peripheral has its own timer or PWM and the firmware just feeds it, monitor mode is the right call.” If the peripheral is genuinely software-stepped (bit-banged SPI, software UART), halt mode is fine, the peripheral is going to stop anyway.
Where it falls down
Monitor mode is not free. Three honest limitations:
- DebugMon handler priority is a real decision. If you set it lower than your motor-control ISR, your debug responsiveness drops when the ISR is busy. If you set it equal or higher, you risk starving the ISR if you sit in a watch-expression evaluation for too long. The standard pattern: DebugMon priority just above the application background tasks, just below the time-critical ISRs. Tune by measuring.
- Background memory access has limits. Reading large memory regions or live variables while the target runs uses J-Link’s background access, which competes for bus cycles with the application. On a heavily-loaded core, you’ll see visible jitter on the motor-control ISR if you set up too many live watches. Keep the live watch list short during sensitive debug.
- Stack discipline matters. The DebugMon handler runs on the main stack and uses ~200 bytes for register save / debug shim state. Tight-stack applications need to budget for it.
None of these are showstoppers, they’re the cost of getting non-halt debug on a real-time target. Teams that adopt monitor mode usually report it after their first PWM bring-up cycle and don’t go back.
The workflow with Ozone
Configuring monitor mode in Ozone is a one-line change. In the Ozone command file:
Project.SetMonModeDebug(MMD_OPTION_PERMANENT);That puts the J-Link in monitor mode and keeps it there across sessions. To go back to halt mode for a different debug session:
Project.SetMonModeDebug(MMD_OPTION_DISABLE);You can also drive it from J-Link Commander or via the J-Link control panel during a session, useful when you want halt mode for non-time-critical code and monitor mode for the ISR work.
The breakpoints behave exactly as you expect: hit, inspect, step, continue. The only visible difference is that the motor doesn’t freewheel.
How Indian engineering teams use it
Motor control and power electronics are increasingly important domains for Indian engineering teams across Bengaluru (EV-traction Tier-1 suppliers, automotive HIL), Pune (industrial motor drives, white-goods), Chennai (EV-powertrain, agricultural pumps, two-wheeler ECUs), and Hyderabad (aerospace actuator control, defence power systems). All of these workloads have the same characteristic: a time-critical PWM or current loop that absolutely cannot stall during firmware debug.
The teams that use monitor mode well share three habits:
- They pick silicon with Cortex-M3 / M4 / M7 / M23 / M33 / M55 / M85 cores when motor or power-electronics work is on the roadmap. They avoid M0/M0+ for the control loop, even when the M0+ would be cheaper per unit, because the debug-time cost of halt-only firmware swamps the silicon savings.
- They standardise on a single DebugMon handler priority across the firmware codebase. New ISRs reference the priority constant. Nobody invents a new one mid-project.
- They have a “monitor mode demo” on the bench. When a new engineer joins, the first thing they see is the same J-Link, the same target, the same breakpoint, once in halt mode (motor stalls) and once in monitor mode (motor keeps spinning). The mental model lands in five minutes.
GSAS engineers help customer teams in India set this up, from picking the J-Link variant (any model that supports the Unlimited Flash Breakpoints upgrade works; PLUS, PRO, PRO PoE, Ultra are the right tier), to configuring Ozone, to choosing the DebugMon priority that fits the customer’s ISR stack.
Frequently asked questions
Does Monitor Mode work on Cortex-M0 or M0+? No. Monitor mode requires the DebugMon exception, which is present on Cortex-M3, M4, M7, M23, M33, M55, and M85, but not on M0 or M0+. If your motor-control loop runs on an M0/M0+, you only have halt mode available. The motor will stall on every breakpoint.
Does Monitor Mode require a specific J-Link model? No, every J-Link from BASE upward can drive monitor mode on a supported Cortex-M target. The capability is in the Cortex-M core + the J-Link software, not the probe hardware. Pick the J-Link model by your throughput, Ethernet, and CI needs, not by monitor-mode support.
Does Monitor Mode work with the EDU Mini? Yes technically, but read the EDU Mini commercial-use prohibition first: covered in detail in our J-Link buying guide. EDU Mini is licensed for educational and non-commercial use only. If your motor-control firmware has any commercial intent, you need a BASE or higher.
Can I use Monitor Mode with VS Code + cortex-debug instead of Ozone?
Yes, the J-Link GDB Server supports monitor-mode commands, and any GDB front-end (VS Code’s cortex-debug, Eclipse, command-line GDB) can drive it via monitor commands. The configuration is less polished than in Ozone, but the underlying capability is the same.
What’s the DebugMon handler priority I should pick? The standard pattern is to set DebugMon priority just above application background tasks and just below your time-critical ISRs (motor-control PWM, current-loop, contactor sequencing). On Cortex-M’s NVIC, that usually means priority 4 or 5 if your motor ISR is at priority 0–2. Tune by measuring ISR jitter while debugging.
Will Monitor Mode protect me from a runaway motor caused by my firmware bug? No, monitor mode keeps the motor running with whatever the firmware last commanded. If your bug commanded a 100% duty cycle right before the breakpoint, monitor mode will faithfully keep that 100% duty cycle going. The protection it gives you is operational: PWM keeps modulating, ADCs keep sampling, hardware peripherals stay alive. Functional protection still requires watchdog timers, overcurrent comparators, and the hardware-safety architecture you’d design anyway.
Where GSAS comes in
As an authorized India engineering partner, GSAS Micro Systems helps power-electronics, motor-control, and battery-management teams configure monitor-mode debug correctly, from picking the J-Link tier (start with PLUS or higher for Unlimited Flash Breakpoints), through Ozone setup, through DebugMon priority tuning on the customer’s actual ISR stack. We pair on the bench with the customer’s hardware so the first monitor-mode session lands on a working motor, not a textbook example.
If your team is staring at a motor-control bug that you can’t catch because every breakpoint stalls the motor, or you’re shipping a power-electronics product and your firmware debug velocity is bottlenecked by the PWM having to be safe-quiescent before every step, talk to GSAS. That’s exactly the workflow we deploy.
Also appears in:
Interested in SEGGER tools?
Talk to our application engineers for personalized tool recommendations.
More from SEGGER
View all →
Meet the GSAS Team at electronica India 2026, Stall H3.I45
15 Sept · 3 min
J-Link Is Now Validated by ST for StellarStudio
13 Sept · 2 min

An AI Agent That Drives the Debugger: SEGGER and Embedder Connect J-Link to the Loop
13 Sept · 6 min

SEGGER J-Link and J-Trace Now Support Andes Trace: Why This Matters for RISC-V
21 Jul · 6 min

Emulating Processor Power for Thermal Testing: Why Constant Power
7 Oct · 7 min

CRPS and Rack Power Supply Testing: The Six Tests That Matter
7 Oct · 7 min