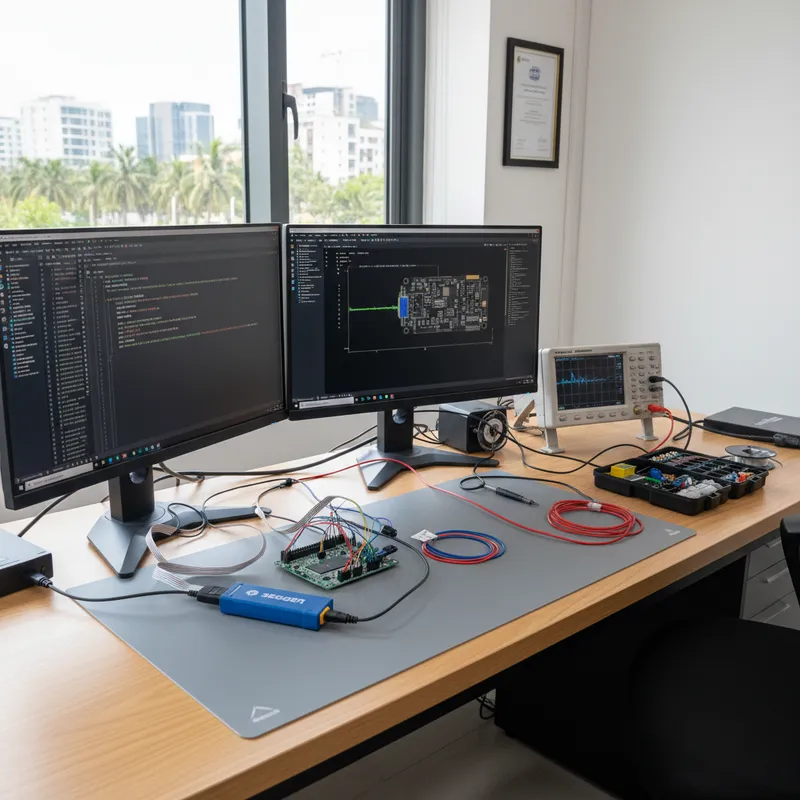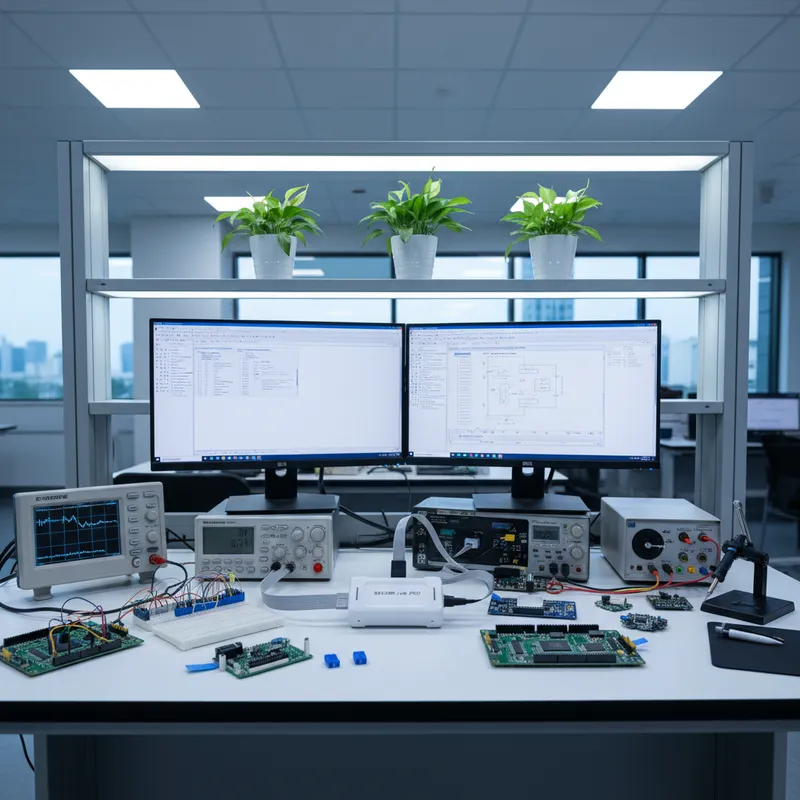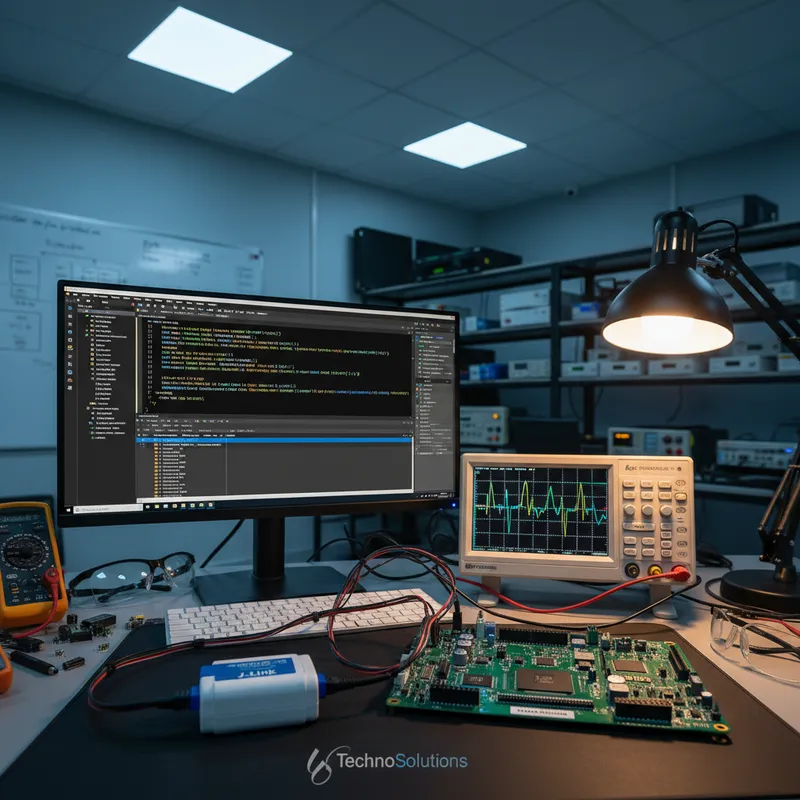
Cortex-M HardFault is the single most common crash category in Indian firmware support tickets. Across STM32, Nordic nRF52/nRF53, NXP i.MX RT, Renesas RA, and every other Arm Cortex-M silicon family Indian product teams are building on, the same exception shows up at roughly 02:00 the week before a customer demo, and the same question gets asked in every engineering WhatsApp group in Bengaluru, Pune, Chennai, and Hyderabad: “The CPU jumped to 0xFFFFFFFE. What happened?”
This post walks through exactly what happened and, more importantly, how to find out in minutes instead of hours. It is based on SEGGER’s public application note AN00016, Analyzing HardFaults on Cortex-M CPUs, localized for the Indian embedded engineering context and the specific silicon families Indian teams are running in production today. GSAS Micro Systems is an authorized SEGGER partner, J-Link, Ozone, SystemView, and RTT-based debugging are available with local support across 11 offices across India.
What a HardFault actually is
Arm Cortex-M has four fault categories: UsageFault (illegal instruction, divide by zero, unaligned access on strict cores), BusFault (memory access the bus could not satisfy), MemManage (MPU violation), and HardFault (the escalation target when any of the above is raised but its own handler is disabled, or when a fault occurs inside another fault handler).
On most Indian production firmware, the three configurable fault handlers are left disabled at reset and every fault escalates to HardFault. This is fine in steady state but it means every fault arrives at the same handler and loses the context about which specific condition triggered it. The first step in any HardFault debug session is therefore decoding the fault back to its underlying cause, which is the information the Cortex-M hardware captures for you in the System Control Block (SCB) fault-status registers.
The four registers every Indian firmware engineer should read
CFSR(Configurable Fault Status Register): the primary decoder. Split into three 8-bit fields:UFSR(upper),BFSR(middle),MMFSR(lower). Each bit identifies one specific cause.UFSR’sUNDEFINSTRbit fires on illegal instructions.BFSR’sPRECISERRfires on synchronous bus faults with a valid address inBFAR.MMFSR’sDACCVIOLfires on MPU data-access violations.HFSR(HardFault Status Register): tells you whether the HardFault was escalated from a lower-priority fault (FORCEDbit) or was a direct vector-table fault (VECTTBLbit). Almost all production firmware HardFaults haveFORCED = 1, which means the real information is inCFSR.BFAR(BusFault Address Register): the address the bus tried to access when the fault occurred, valid only whenBFSR.BFARVALID = 1. On a NULL dereference this typically reads0x00000000or a small offset from it.MMFAR(MemManage Fault Address Register): the address of the MPU violation, valid only whenMMFSR.MMARVALID = 1. Essential when your MPU-protected RTOS task crossed its stack boundary.
SEGGER’s AN00016 includes a compact generic HardFault handler that reads all four registers, unpacks the fault cause, and prints the result in human-readable form over RTT so the running firmware can report its own crash without a live debugger attach. This is the workflow most Indian professional teams standardize on.
Installing the SEGGER generic HardFault handler
AN00016 ships a single C file with one HardFault handler implementation that you drop into your project’s startup code. It is written to be vendor-agnostic, no STM32 HAL dependency, no Nordic SoftDevice dependency, no NXP MCUXpresso assumption. It calls SEGGER’s RTT printf to emit the decoded fault state over the debug pin without halting the CPU.
Integration steps on the common Indian silicon families:
- STM32 (any Cube-generated project): replace the default
HardFault_Handlerinstm32xx_it.cwith the SEGGER version. No CubeMX regeneration concerns, the handler is stateless. - Nordic nRF52/nRF53 (SDK or Nordic Connect SDK / Zephyr): for bare-SDK projects, replace
HardFault_Handleringcc_startup_nrf5*.s. For Zephyr-based Nordic Connect SDK projects, use Zephyr’sCONFIG_ARM_UNWINDpath to integrate the decoder into Zephyr’s own fault handler, Zephyr already has excellent fault decoding built in, so the RTT printout is additive rather than replacement. - NXP i.MX RT (MCUXpresso or command-line): replace
HardFault_Handlerin the MCUXpresso startup file or the generic Cortex-M startup that ships with the SDK. On dual-core RT1170 (M7 + M4), install the handler on both cores, each core has its own vector table and its own HardFault handler. - Raspberry Pi RP2040 / RP2350: install on both cores via the
pico_sdk’sirq_set_exclusive_handlerpath.
Capturing the fault state over RTT without a live debug attach
Here is the thing AN00016 makes possible that changes Indian firmware debug practice. Once the SEGGER HardFault handler is installed, any crash the unit experiences, in the lab, on the test bench, in a customer’s facility, at a trade show, is streamed over RTT and captured by JLinkRTTViewer or JLinkRTTLogger on the laptop connected via J-Link.
The key: RTT does not need a debug session to be active. The J-Link can be attached to the running system in “no halt” mode, and as long as the target CPU is physically connected to the debug pins and JLinkRTTLogger is running on the host, any RTT output the firmware emits is captured, including the fault decoder output at the moment of a crash. No breakpoints, no stepping, no interference with the running system’s real-time behavior.
Practically, the Indian debug workflow is:
- Install the SEGGER HardFault handler and the RTT init code in your startup.
- On every bench running the unit, leave a J-Link attached (a cheap J-Link BASE or J-Link PLUS Compact is enough for this role).
- Start
JLinkRTTLoggerpointing at a dated log file on the bench PC. - Run the unit normally, customer demo, stress test, field trial, whatever.
- When a HardFault happens (and it will, this is firmware engineering), the decoder output is in the log file, timestamped.
Hours of “step through the code and hope” replaced by a timestamped log line like:
[12:43:17] *** HardFault ***
           CFSR  = 0x00000200 (PRECISERR)
           HFSR  = 0x40000000 (FORCED)
           BFAR  = 0x00000024 (bus fault at 0x24)
           LR    = 0xFFFFFFED (thread mode, PSP)
           Stack frame @ 0x20001FC0:
             R0=0x00000024  R1=0x00000000  R2=0x00000000  R3=0x00000000
             R12=0x00000000 LR=0x08001234  PC=0x08002A40 xPSR=0x61000000
You can go straight from that log entry to objdump -d firmware.elf | grep -A 5 '8002a40:' to find the exact line that dereferenced the bus address 0x24.
The three most frequent causes of HardFaults in Indian production firmware
From GSAS’s field observations across several dozen customer engagements, the root causes of Indian production HardFaults cluster into three categories:
- NULL pointer dereference: typically a callback pointer that was never registered, or a structure field that was not initialized at boot before an interrupt tried to dispatch through it. Signature:
BFARreads a small value (0-64),CFSR = 0x00000200(PRECISERR). Fix: initialize aggressively, use MPU to catch NULL dereferences, add assertion macros that RTT-log their failures. - Stack overflow into a peripheral region: a task stack or ISR stack grows past its allocated bound and starts trampling on SFR space. Signature:
BFARreads something in the peripheral address range (0x40000000and up on STM32),CFSR = 0x00000200. Fix: turn on MPU-based stack protection (RTOS-managed for embOS, FreeRTOS, and Zephyr), increase stack sizes, use SystemView to catch stack high-watermarks. - Unaligned memory access on cores that enforce alignment: typically a struct packed differently than the compiler expected, accessed via a cast. Signature:
UFSR.UNALIGNED = 1,CFSR = 0x01000000. Fix: respect alignment attributes, use__packedcarefully, turn off “treat unaligned accesses as OK” in the memory controller only as a last resort.
Every one of these root causes shows up clearly in the RTT log the SEGGER handler emits. The hard part is never “what was the fault”, it is “which line of code caused it”, and the PC + LR in the stack frame point you at that exact line.
Why this workflow needs J-Link specifically
You can in principle do this same thing with ST-LINK, Nordic’s on-board debugger, the NXP LPC-Link, or a CMSIS-DAP clone. The practical reality is that RTT throughput on non-SEGGER probes is either very slow (most ST-LINK clones), unreliable (CMSIS-DAP implementations without proper flow control), or requires additional workarounds through OpenOCD that don’t fit into a standing “always-on” logging role.
J-Link was designed around RTT as a first-class feature. Every J-Link model, from the entry J-Link BASE to the flagship J-Link PRO and the Ethernet-isolated J-Link ULTRA, runs RTT at hardware speed with no special configuration. The JLinkRTTLogger utility ships with the SEGGER software pack. The Ozone GUI debugger integrates the RTT viewer natively. This is the combination that makes the “leave the probe attached, capture everything” workflow actually practical on Indian benches.
For CI racks that flash and test Indian firmware at volume, the J-Link PRO is worth the step up, Ethernet interface removes USB cable contention, isolated JTAG protects the host PC when testing high-current targets, and the probe sits cleanly in a rack alongside other test equipment.
Ordering J-Link and setting up the HardFault debug workflow in India
GSAS is an authorised engineering partner in India and supplies the J-Link family on quote. Whether you are a startup team in Bengaluru debugging your first STM32 product, an automotive Tier-1 in Pune building a dual-core i.MX RT1170 ECU, or a medical device OEM in Hyderabad running 24/7 stress tests on an nRF52 wearable, contact us for model selection guidance and a hands-on session on installing the SEGGER HardFault handler in your codebase.
Further reading
- SEGGER AN00016, Analyzing HardFaults on Cortex-M CPUs, the canonical reference with full code
- SEGGER Knowledge Base, RTT, Real-Time Transfer deep dive
- SEGGER Knowledge Base, J-Link, probe reference
- Buying the right J-Link for development
- SystemView V4, what’s new for Indian embedded teams, catching timing bugs before they turn into HardFaults
- SEGGER Ozone debugger, for visual fault analysis
Interested in SEGGER tools?
Talk to our application engineers for personalized tool recommendations.
More from SEGGER
View all →
Meet the GSAS Team at electronica India 2026, Stall H3.I45
15 Sept · 3 min
J-Link Is Now Validated by ST for StellarStudio
13 Sept · 2 min

An AI Agent That Drives the Debugger: SEGGER and Embedder Connect J-Link to the Loop
13 Sept · 6 min

SEGGER J-Link and J-Trace Now Support Andes Trace: Why This Matters for RISC-V
21 Jul · 6 min

Emulating Processor Power for Thermal Testing: Why Constant Power
7 Oct · 7 min

CRPS and Rack Power Supply Testing: The Six Tests That Matter
7 Oct · 7 min