Every inductor has a saturation current. Below that current, the inductor behaves as intended, storing and releasing energy predictably. Above it, inductance collapses as the magnetic core material runs out of capacity to support additional flux. The transition between these two regions defines the practical operating limit of the component.
The saturation current, Isat, is typically defined as the DC current at which inductance drops by a specified percentage from its nominal value, commonly 20% or 30%, depending on the manufacturer and application. It is the single most important parameter for power inductor selection in switch-mode converters, and it cannot be measured without DC bias current testing.
Why Zero-Current Measurements Are Insufficient
A standard LCR meter applies a small AC signal, milliamps, and measures inductance at that signal level. The resulting value is the nominal inductance at zero DC bias. For sorting and grading passive components, this is adequate. For power inductor characterization, it is not.
The relationship between inductance and DC current is nonlinear. A ferrite-core inductor might hold its nominal inductance well past 50% of its rated current, then drop sharply. A powdered iron or alloy core inductor might show a gradual, near-linear decline. A composite core might exhibit a two-stage roll-off. None of this behaviour is visible without applying DC bias current and measuring inductance at each current level.
How DC Bias Isat Measurement Works
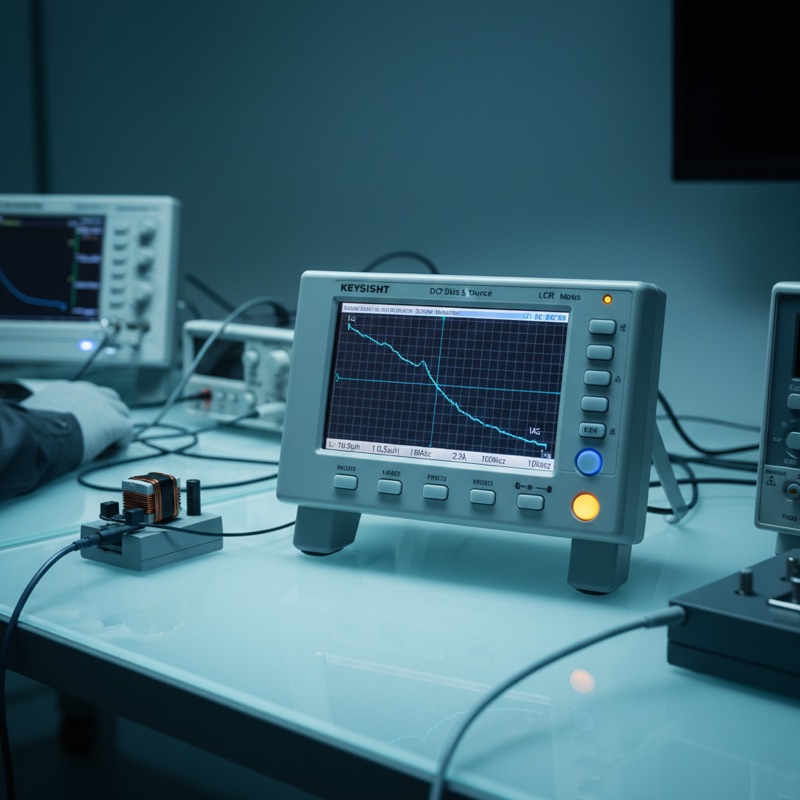
The Microtest DC Bias system combines an LCR meter or impedance analyzer with a programmable DC current source. The DC current source applies a controlled bias to the inductor while the LCR meter simultaneously measures inductance at the AC test frequency.
The system performs an automated current sweep, stepping from zero to maximum DC current in programmable increments, and records inductance at each step. The result is a saturation curve: L versus IDC, plotted graphically on the instrument display and exportable via PC Link software.
Current/frequency graphic scanning analysis. The system can sweep both DC current and AC test frequency, generating a three-dimensional characterization of inductance versus current versus frequency. This reveals frequency-dependent saturation behaviour that a single-frequency sweep would miss.
Inductance drop percentage display. The Microtest system shows the inductance drop as a percentage relative to the zero-bias value at each current step. Engineers set their Isat threshold, say, 20% drop, and the system identifies the exact current at which that threshold is crossed.
Built-in permeability function. The system calculates relative permeability (ur) from the measured inductance and known core geometry, enabling material-level characterization alongside component-level testing.
Applications by Inductor Type
Power inductors. The primary application. Isat determines the maximum continuous current a power inductor can handle in a buck, boost, or buck-boost converter before the control loop loses inductance margin. DC bias testing with the 6632+ system (100 Hz to 10 MHz) or 6350+ system (100 Hz to 500 kHz) provides the full saturation curve.
Common mode inductors. Used in EMI filters, common mode chokes operate with both common mode and differential mode currents. Differential mode current acts as a DC bias, and saturation under that bias degrades filtering performance. DC bias testing quantifies this effect.
Filter inductors. In active power factor correction circuits, the filter inductor carries a large DC component with AC ripple superimposed. Isat must exceed the peak current, DC plus ripple, under worst-case load and line conditions.
PFC inductors. Boost PFC inductors operate at high DC bias with high-frequency ripple. Saturation characterization across both current and frequency is essential for reliable PFC design.
Ferrite and alloy magnetic materials. Core material manufacturers use DC bias testing to characterize permeability versus bias, generating the data that appears in material datasheets. The Microtest system’s built-in permeability function supports this workflow directly.
From Measurement to Design Confidence
The saturation curve is the bridge between a component datasheet and a working power converter. Datasheet Isat values are measured under specific conditions, a specific test frequency, ambient temperature, and drop percentage definition. If the application conditions differ, the only reliable approach is to measure Isat under application-representative conditions.
DC bias testing provides that measurement. For engineers designing power converters, for quality teams inspecting incoming inductors, and for inductor manufacturers validating production consistency, Isat measurement is the fundamental test that underpins confidence in the magnetic component.
Availability in India
GSAS is an authorized engineering partner in India, providing the complete DC Bias Current Test System portfolio, from the 6350+ LCR-based system to the 6632+ impedance-analyzer-based system and standalone current source modules up to 640 A. Local applications support, training, and INR invoicing available across Bengaluru, Hyderabad, Chennai, Pune, Mumbai, Delhi NCR, and Visakhapatnam.
Also appears in:
Interested in Microtest tools?
Talk to our application engineers for personalized tool recommendations.
More from Microtest
View all →
Power Measurement for Server PSUs: Microtest 7140 Power Analyzer
7 Apr · 5 min

Wireless Charger QC Testing with the Microtest 9901
7 Apr · 5 min

Motor Stator Testing in EV Manufacturing: Microtest MT-6910 Series
7 Apr · 5 min
PCB Incoming Inspection with Multichannel LCR Testing
6 Apr · 5 min

Emulating Processor Power for Thermal Testing: Why Constant Power
7 Oct · 7 min

CRPS and Rack Power Supply Testing: The Six Tests That Matter
7 Oct · 7 min