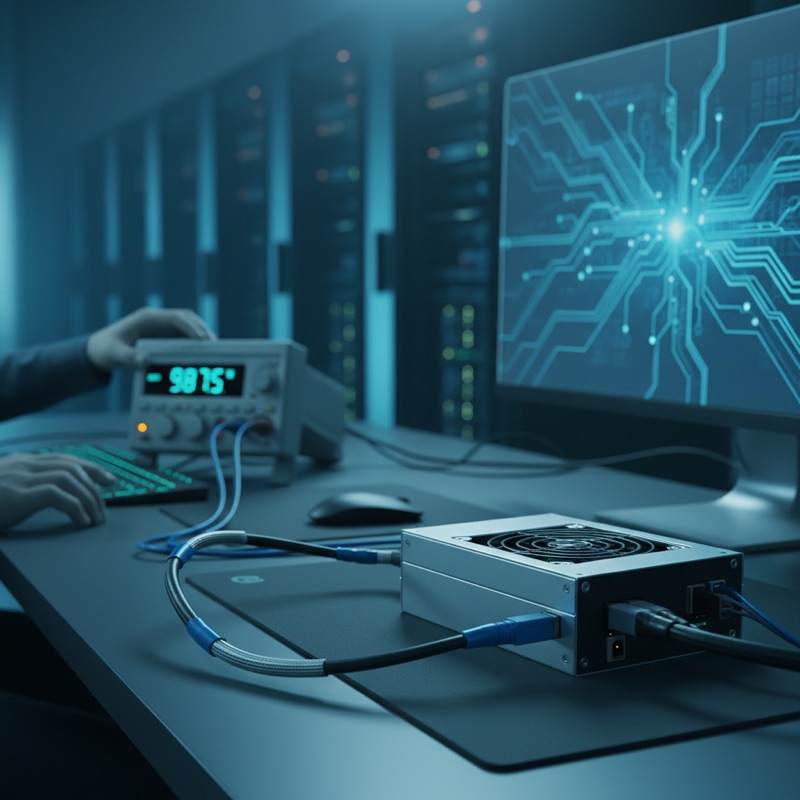
Server power supply design is governed by efficiency specifications at multiple load points, 10%, 20%, 50%, and 100% of rated load, plus standby power consumption when the server is powered off but the PSU remains connected to mains. Meeting these specifications requires power measurement instrumentation that spans the full dynamic range: from sub-milliwatt standby power to kilowatts at full load, with accuracy that makes the compliance measurement meaningful.
The Microtest 7140 Power Analyzer covers this range. It is a single-phase AC/DC power meter with a measurement range from 0.001 W to 16 kW, four orders of magnitude in a single instrument, covering both the standby and full-load measurement points without changing instruments, ranges, or test setups.
Standby Power: The Low-End Challenge
Standby power measurement is deceptively difficult. When a server PSU is in standby, it draws a small current, often a few milliamps, at highly distorted waveform shapes. The power factor is low, the current waveform is spiky, and the actual power consumption may be a fraction of a watt.
Measuring sub-watt power accurately requires both high current sensitivity and correct handling of non-sinusoidal waveforms. A power meter that averages or approximates the waveform will produce incorrect results.
The Microtest 7140 addresses this with a standby power DPI (Display Performance Index) of 0.001 W, capable of resolving milliwatt-level power consumption. The AC/DC dual amp/watt-hour measurement architecture captures both the AC and DC components of the input, providing correct power readings regardless of waveform distortion.
Full-Load Power: The High-End Requirement
At full load, a 3 kW server PSU draws significant current at unity or near-unity power factor. The measurement challenge shifts from sensitivity to accuracy, small percentage errors in power measurement translate to meaningful errors in calculated efficiency.
The 7140’s wide measurement range up to 16 kW accommodates multi-kilowatt server PSUs and industrial power supplies without requiring external current transducers for most applications. Direct input measurement avoids the additional uncertainty introduced by external CTs or shunts.
Efficiency Testing Workflow
Server PSU efficiency testing follows a standard workflow:
-
AC input power measurement. The 7140 measures input voltage, input current, input power, and power factor at the mains input of the PSU.
-
DC output power measurement. A second measurement, either from the 7140 itself in DC mode or from a DC load with power measurement, captures the output power at each load point.
-
Efficiency calculation. Output power divided by input power at each load point gives the efficiency curve. The 7140’s connection software enables data export for efficiency calculation and reporting.
-
Standby power measurement. With the server in standby mode (PSU energized but no load), the 7140 measures the residual power consumption at 0.001 W resolution.
Expansion and Integration
The 7140 platform supports various expansion cards for additional test functions. These expansion capabilities extend the base instrument to cover broader power measurement applications, multi-channel input, extended measurement parameters, or integration with other test equipment in automated test systems.
Connection software provides remote control, data logging, and data export to PC-based analysis tools. For production testing environments where power measurement is one step in a multi-test sequence, software integration enables automated test execution and result recording.
Applications Beyond Server PSUs
The 7140’s wide dynamic range makes it applicable across power measurement tasks:
LED drivers. Efficiency and power factor measurement from milliwatt standby to tens of watts at full brightness.
Battery chargers. Input power measurement during charging profiles, from trickle charge at low power to fast charge at maximum power.
Motor drives. Input power measurement for efficiency calculations at various speed and load points.
Industrial power supplies. Compliance testing for efficiency regulations across the load range.
Consumer electronics. Standby power compliance testing for energy labeling requirements.
Why Accurate Power Measurement Matters
For Indian power supply manufacturers and contract manufacturers testing PSUs for export, the power analyzer is the compliance gatekeeper. 80 PLUS, EU Ecodesign, and BEE star rating programmes all specify efficiency thresholds measured with calibrated power analyzers. The measurement uncertainty of the power analyzer directly affects the design margin needed, a more accurate instrument allows tighter design margins, which translates to lower component cost and competitive advantage.
The 7140 provides the measurement capability to test against these standards with traceable accuracy, supporting both the design engineering team during development and the quality team during production verification.
Availability in India
GSAS is an authorized engineering partner in India, providing the 7140 Power Analyzer with local calibration, application support, and INR invoicing. Our team serves power supply manufacturers, test labs, and electronics OEMs across Bengaluru, Hyderabad, Chennai, Pune, Mumbai, Delhi NCR, and Visakhapatnam.
Also appears in:
Interested in Microtest tools?
Talk to our application engineers for personalized tool recommendations.
More from Microtest
View all →
Wireless Charger QC Testing with the Microtest 9901
7 Apr · 5 min

Motor Stator Testing in EV Manufacturing: Microtest MT-6910 Series
7 Apr · 5 min
PCB Incoming Inspection with Multichannel LCR Testing
6 Apr · 5 min
Hipot Testing for Indian Manufacturers: Microtest 7630/7631 Series
6 Apr · 5 min

Emulating Processor Power for Thermal Testing: Why Constant Power
7 Oct · 7 min

CRPS and Rack Power Supply Testing: The Six Tests That Matter
7 Oct · 7 min