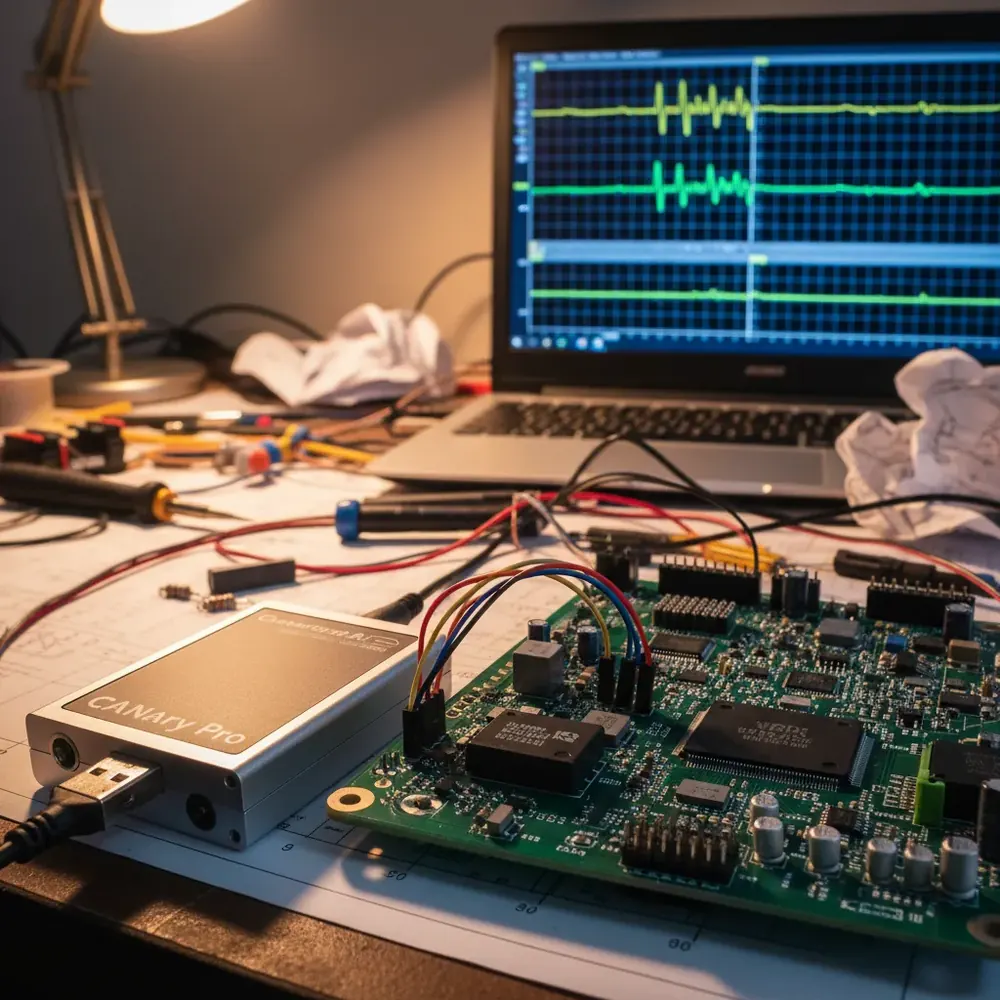
CAN bus debugging often begins with a deceptively simple question: what is actually happening on the bus? Oscilloscope waveforms show voltage transitions, but they do not reveal message IDs, data payloads, error conditions, or arbitration outcomes. The Komodo CAN Duo Interface, paired with Total Phase’s Data Center Software, provides protocol-level visibility into CAN 2.0A and CAN 2.0B traffic, showing every frame, every error, and every timing relationship in a format that embedded engineers can act on immediately.
Setting Up Dual-Channel CAN Capture
The Komodo CAN Duo’s two independent CAN channels make it uniquely capable for multi-bus automotive and industrial systems. A common configuration uses Channel A in passive (listen-only) mode to capture production bus traffic while Channel B actively transmits diagnostic requests or test stimuli using the Komodo GUI Software.
Each channel is galvanically isolated from the host PC and from each other, preventing ground loops that are particularly common when connecting test equipment to vehicle CAN buses where multiple ground references exist. The extended -40C to +85C operating temperature range means the Komodo can be deployed directly in engine bay or factory floor environments.
To begin capture, connect the Komodo to your CAN bus using the included split cable, set the baud rate in Data Center Software (common rates: 125 kbps for fault-tolerant CAN, 250 kbps or 500 kbps for high-speed, 1 Mbps for CAN FD-compatible systems), and start recording. Data Center displays captured CAN frames in real time.
Understanding the CAN Frame Display
Each captured CAN frame in Data Center Software shows:
- Timestamp: hardware-level timing with nanosecond precision, essential for measuring inter-frame spacing and bus latency.
- CAN ID: the 11-bit (standard) or 29-bit (extended) message identifier, which determines priority during bus arbitration.
- DLC: the Data Length Code indicating how many data bytes the frame contains (0–8 for CAN 2.0).
- Data payload: the actual bytes transmitted, displayed in hex.
- Error details: if the frame contained errors, the specific error type and position within the frame.
CAN Error Analysis
CAN bus errors are often the most difficult protocol issues to diagnose because they are transient and context-dependent. Data Center Software captures and categorizes every error frame:
- Bit errors (B): a transmitting node detected that the bit it placed on the bus was overwritten. Common cause: two nodes transmitting simultaneously with incorrect arbitration.
- Form errors (F): fixed-format fields in the CAN frame (delimiter, EOF, CRC delimiter) contained illegal bit values. Often indicates timing or synchronization issues.
- Stuff errors (S): the bit-stuffing rule (no more than 5 consecutive bits of the same value) was violated. Can indicate cable impedance mismatches or excessive bus length.
- Other errors (O): CRC mismatches, acknowledgment errors, or bus-off conditions.
The Statistics pane aggregates error counts by type and direction (TX/RX), while the Navigator pane enables packet-by-packet error inspection. For intermittent errors that only occur under specific bus load conditions, Data Center’s streaming capture to disk allows hours of continuous monitoring without buffer limitations.
Timing Analysis for Automotive CAN
CAN timing analysis is critical for automotive teams validating ECU response times and bus utilization:
- Cycle time: measuring the interval between consecutive instances of the same CAN ID to verify that periodic messages (e.g., engine RPM, wheel speed) are transmitted at the specified rate.
- Inter-frame spacing: verifying that minimum inter-frame spacing requirements are met, which affects bus arbitration fairness and real-time guarantees.
- Bus load: calculating the percentage of bus bandwidth consumed by all messages, ensuring the system has sufficient headroom for burst traffic and error retransmissions.
- Response latency: measuring the time from a diagnostic request (e.g., UDS 0x22 Read Data By Identifier) to the ECU’s response.
The Last Packet View in Data Center provides per-CAN-ID statistics including packet count and average interval, enabling rapid identification of nodes that are transmitting too fast, too slow, or erratically.
Practical Workflow for Indian Automotive Teams
For automotive development teams across India working on commercial vehicle ECUs, two-wheeler body controllers, and passenger car infotainment systems, the Komodo CAN Duo provides the dual-channel capability to monitor multiple CAN buses simultaneously, a common requirement when debugging gateway ECUs that bridge powertrain CAN and body CAN networks.
GSAS Micro Systems supports Komodo deployments with instrument selection guidance, CAN bus workshop delivery, and applications engineering for teams integrating the Komodo into automated test setups using the Python or LabVIEW APIs.
Also appears in:
Interested in Total Phase tools?
Talk to our application engineers for personalized tool recommendations.
More from Total Phase
View all →
Aardvark vs Cheetah vs Promira: Total Phase Host Adapter Guide (India)
17 Jul · 6 min
Automated EV Charger Test Bench in India: GW Instek AC Source, DC Load and Battery Emulator
6 Jun · 16 min
Best Logic Analyzer in India (2026): A Vendor-Neutral Buying Guide for Embedded Teams
5 Jun · 10 min
Capturing I²C/SPI Data to Train Edge AI: A Protocol-Analyzer Workflow for Indian Embedded Teams
4 Jun · 9 min

Emulating Processor Power for Thermal Testing: Why Constant Power
7 Oct · 7 min

CRPS and Rack Power Supply Testing: The Six Tests That Matter
7 Oct · 7 min