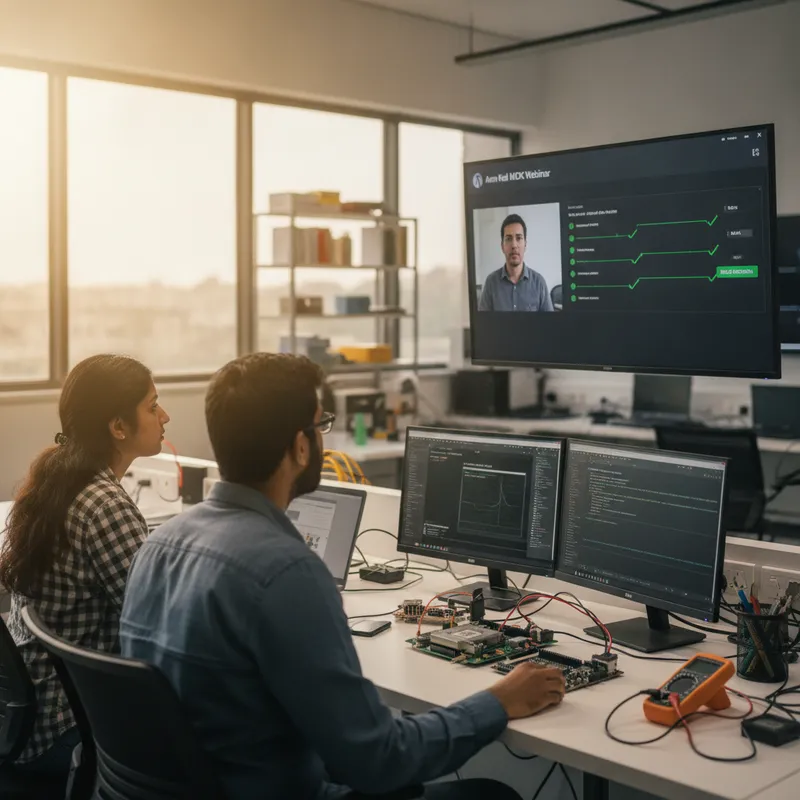
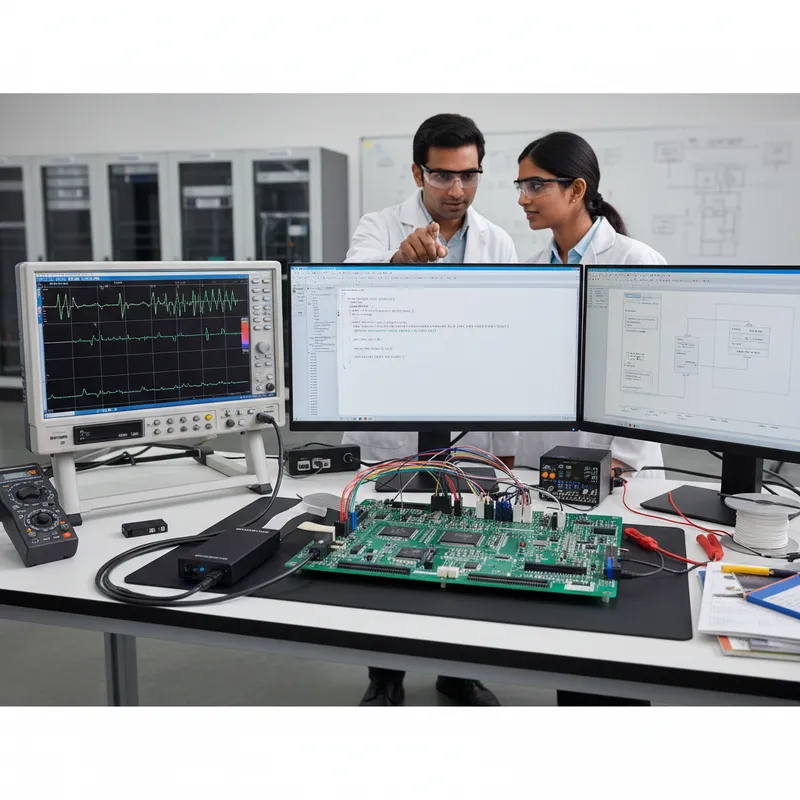
Every team building edge AI eventually runs into the same wall: the model is fine, but the data is not. You can download a public dataset to prototype a classifier, but a model that has to flag a failing sensor or an out-of-spec power sequence on your board has to learn from your board. And for the overwhelming majority of embedded systems, the signal that matters is already flowing across two unglamorous wires, the I²C and SPI buses that connect the sensors, the power-management ICs and the memory to the MCU.
That is the quiet advantage of a protocol analyzer in an AI workflow. Long before a single line of model code is written, the bus is a continuous, timestamped record of exactly how the hardware behaves when it is healthy, and, later, exactly how it behaves when it is not. Capturing that record cleanly is the first and most under-rated step in any practical edge-AI project. This article walks through how to do it with Total Phase host adapters and protocol analyzers, and how the captured data feeds an on-device anomaly-detection model.
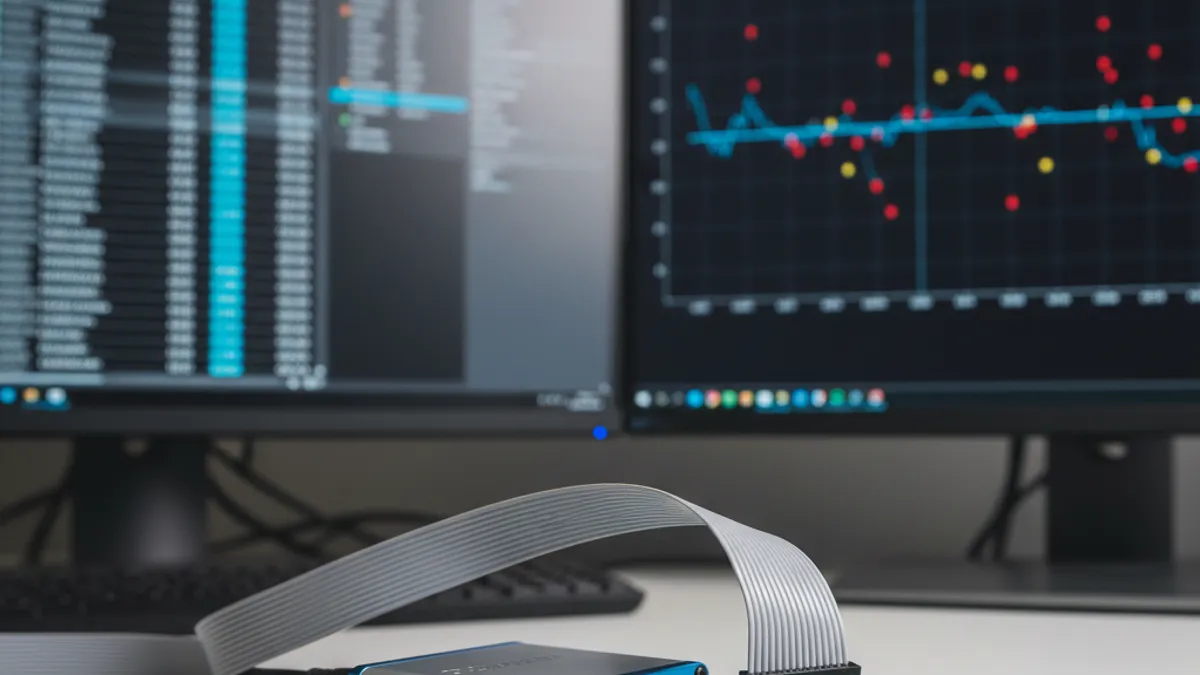
Why the model belongs on the edge: and the data on the bus
“Edge AI” simply means running inference on hardware close to where the data is produced, rather than streaming everything to the cloud and waiting for an answer. For an embedded product that buys you three things that matter on a real bill of materials: lower latency (the decision happens in milliseconds, on-device), less bandwidth (you are not paying to ship raw sensor streams upstream), and better data security (sensitive signals never leave the device). For a factory gateway, a medical wearable or an automotive sub-system, those are not nice-to-haves, they are the reason the product can ship at all.
The job that edge AI does best in these systems is anomaly detection: learning what “normal” looks like so it can flag what is not. To train that, you need a clean baseline of normal behaviour and then examples, real or induced, of the three kinds of deviation worth catching:
- Point anomalies: a single reading that is plainly wrong (a temperature register that returns a nonsense value once).
- Contextual anomalies: a reading that is fine in general but wrong in this context (a fan-speed value that is normal at idle but abnormal under load).
- Collective anomalies: a set of readings that are each individually plausible but abnormal taken together (a power rail, a current draw and a thermal reading that only spell trouble in combination).
Catch those early and the device can predict a failing sensor, a flaky communication link or irregular power behaviour before it becomes a field return. The whole exercise depends on one input: a faithful capture of the bus traffic.
Building the dataset: capturing the I²C/SPI bus
The capture pattern is straightforward. A host adapter plays the role of the master, polling each sensor with the same read commands the real MCU would issue, at regular intervals, accelerometers and gyroscopes for position, temperature and pressure sensors for environment, image sensors for cameras, microphones for audio. In parallel, a protocol analyzer sits on the bus non-intrusively and records everything that crosses it.
What the analyzer logs is exactly what a machine-learning pipeline needs: each data packet with its timestamp and transaction duration, the start and stop conditions, the device addresses, and the decoded payload in human-readable form. That decoded, time-aligned stream, not a raw analog blob, is what makes the downstream feature engineering tractable.
The tools, matched to the job
Total Phase makes the two halves of this, the master that drives the bus and the analyzer that watches it, and in one case combines them. Each suits a different point in the speed and budget range:
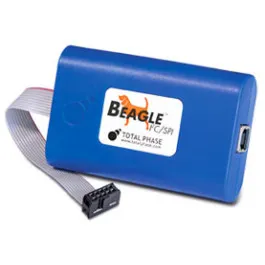
Beagle I²C/SPI Protocol Analyzer
A dedicated, non-intrusive analyzer that monitors and captures I²C traffic up to 4 MHz and SPI up to 24 MHz, giving detailed insight into data exchanges, timing and bus errors. The default choice when you only need to watch the bus, not drive it.
Beagle I²C/SPI →Promira Serial Platform
Host adapter and protocol analyzer in one. Drives I²C up to 3.4 MHz (sniffs to 5 MHz) and SPI up to 80 MHz (sniffs to 40 MHz), supports Single/Dual/Quad SPI, and adds high-speed USB plus gigabit Ethernet, built for continuous, high-throughput data logging.
Promira Platform →Aardvark I²C/SPI Host Adapter
The bench workhorse for the master side. Emulates an I²C master/slave up to 800 kHz and an SPI master up to 8 MHz, so it can poll sensors on a schedule to generate the very traffic you want to capture.
Aardvark Adapter →Data Center Software
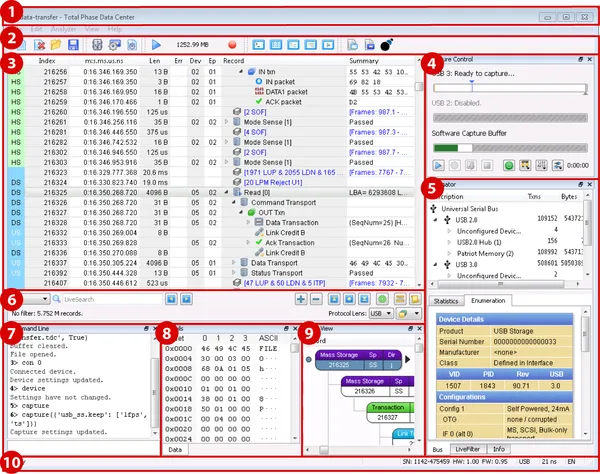
The free, cross-platform capture GUI for every Total Phase analyzer. LiveDisplay shows traffic in real time, LiveSearch finds events, strings and hex patterns, and LiveFilter switches between filtered and full views, then exports the whole capture to CSV for your pipeline.
Total Phase tools →A useful detail for automation: the Promira and the other adapters ship with a free API for custom scripts, so the polling and continuous logging can run unattended for hours, which is exactly what you want when you are trying to accumulate a representative baseline rather than a five-minute sample.
From capture to a deployed model
Once the bus data is captured, the path to an edge model is a well-trodden five-step loop. None of it is exotic; the discipline is in doing each step on data that actually came off your hardware.
- Capture. Export the I²C/SPI session to CSV from Data Center Software. You now have a labelled, time-stamped record of normal operation, and, ideally, a few sessions where you deliberately induced a fault.
- Pre-process. Focus on the data that reflects the chip’s intended function: clean, label and segment the stream, then extract features that a model can learn from, expected timing intervals, sequence patterns, byte-level entropy, signal duration. This is where a decoded, timestamped capture pays off; you are engineering features, not parsing waveforms.
- Choose the model. Match the algorithm to the anomaly. Decision trees classify against known conditions; support vector machines separate categories cleanly; neural networks find complex patterns in large captures; K-means clustering groups similar behaviour. They compose well, for example, cluster first to find structure, then classify. Common frameworks are TensorFlow, ONNX and PyTorch.
- Test and validate. Evaluate with precision, recall and F1, and fine-tune with more data or adjusted parameters. For teams targeting NXP silicon, the eIQ toolkit handles framework integration on the way to the device.
- Deploy to the edge. Export to a device-friendly format, TensorFlow Lite, ONNX or TorchScript: or push straight to an NXP MCU/MPU via eIQ. The model now runs inference on the same kind of bus traffic it was trained on, on the device itself.
The neat part is the symmetry: the protocol analyzer that captured the training data is also the instrument you reach for when you need to debug the deployed system, the same decoded view of the bus, before and after the model exists.
Why this matters for Indian embedded teams
Indian product companies, automotive Tier-1s and design houses are building exactly the kinds of systems where on-device intelligence earns its keep, industrial gateways, energy and battery-management systems, driver-assistance sub-systems, medical and wearable devices. The constraint is rarely the willingness to add AI; it is getting trustworthy, hardware-specific data to train on without standing up a heavyweight data pipeline first.
A protocol analyzer collapses that barrier. A single Beagle or Promira on the bench turns a board into a data source on day one, no custom firmware instrumentation, no cloud round-trip, no waiting for the ML platform decision. For a team in Bengaluru prototyping an anomaly detector, an automotive group in Pune or Chennai validating a sensor sub-system, or a hardware company in Hyderabad, Mumbai or Delhi NCR moving from cloud inference to on-device, the cheapest, fastest first move is to start capturing the bus you already have.
Frequently asked questions
Which Total Phase tool should I start with for data capture? If you only need to observe the bus, the Beagle I²C/SPI Protocol Analyzer is the direct choice (I²C to 4 MHz, SPI to 24 MHz). If you also need to drive the bus, poll sensors to generate traffic, or you need higher SPI speeds and continuous high-throughput logging, the Promira Serial Platform combines host adapter and analyzer in one unit.
Do I need to write code to capture and export the data? No. Data Center Software captures and exports to CSV through a GUI, with LiveDisplay, LiveSearch and LiveFilter to inspect and narrow the capture. When you want to automate long unattended logging runs, the free API lets you script the host adapter.
What features actually go into the model? From a decoded bus capture you typically derive timing intervals between transactions, sequence and addressing patterns, byte-level entropy of the payloads, and transaction/signal duration, the kinds of features that separate normal traffic from a faulty sensor, a flaky link or irregular power behaviour.
Can the trained model run on the device itself? Yes, that is the point of the edge workflow. Models export to TensorFlow Lite, ONNX or TorchScript, or deploy directly to NXP MCUs/MPUs via the eIQ toolkit, so inference runs locally with low latency and without sending raw data to the cloud.
How do I buy Total Phase analyzers in India? GSAS Micro Systems is the authorised Total Phase engineering partner in India. Request a quote for INR pricing with GST, and the GSAS applications team can advise on the right adapter or analyzer for your capture setup.
Where GSAS comes in
GSAS Micro Systems is the authorised Total Phase engineering partner in India. GSAS is a value added distributor/reseller for these products. We have a dedicated FAE team ready to help you with custom built solutions matching your needs. Our applications engineers work with these tools daily and can help your team stand up a bus-capture setup, choose between the Beagle, Promira and Aardvark for your speeds and budget, and plan the path from CSV capture to a deployed edge model. We support embedded and test teams across Bengaluru, Hyderabad, Chennai, Pune, Mumbai and Delhi NCR with pre-sales guidance, GST-compliant quotations and post-sales application support.
For related reading, see:
- Reading a SPI Flash Device ID with the Aardvark Host Adapter
- QSPI Flash Programming with the Promira Serial Platform
- Analyzing CAN Bus Frames and Timing with the Komodo CAN Duo
The model is the easy part. The data is the project, and for embedded edge AI, the data is already on your I²C and SPI buses, waiting to be captured.
Source: Total Phase, “Real-Time I²C/SPI Data Collection for AI Training and Deployment onto Edge Devices”. Product names (Aardvark, Beagle, Promira, Data Center Software) are Total Phase trademarks; TensorFlow, ONNX, PyTorch, NXP and eIQ are trademarks of their respective owners. GSAS Micro Systems is the authorised Total Phase engineering partner in India.
Also appears in:
Interested in Total Phase tools?
Talk to our application engineers for personalized tool recommendations.
More from Total Phase
View all →
Aardvark vs Cheetah vs Promira: Total Phase Host Adapter Guide (India)
17 Jul · 6 min
Automated EV Charger Test Bench in India: GW Instek AC Source, DC Load and Battery Emulator
6 Jun · 16 min
Best Logic Analyzer in India (2026): A Vendor-Neutral Buying Guide for Embedded Teams
5 Jun · 10 min
Analyzing CAN Bus Frames and Timing with the Komodo CAN Duo
23 Mar · 3 min

Emulating Processor Power for Thermal Testing: Why Constant Power
7 Oct · 7 min

CRPS and Rack Power Supply Testing: The Six Tests That Matter
7 Oct · 7 min