Signal Integrity: Where Digital Meets Analog
As clock frequencies and data rates increase, digital signals behave less like clean square waves and more like analog waveforms. Transmission line effects, crosstalk, impedance discontinuities, and parasitic capacitance degrade signal edges, introduce jitter, and close eye diagrams. For hardware engineers designing PCBs with high-speed interfaces, DDR memory, USB, HDMI, Ethernet, PCIe, signal integrity measurement is not optional.
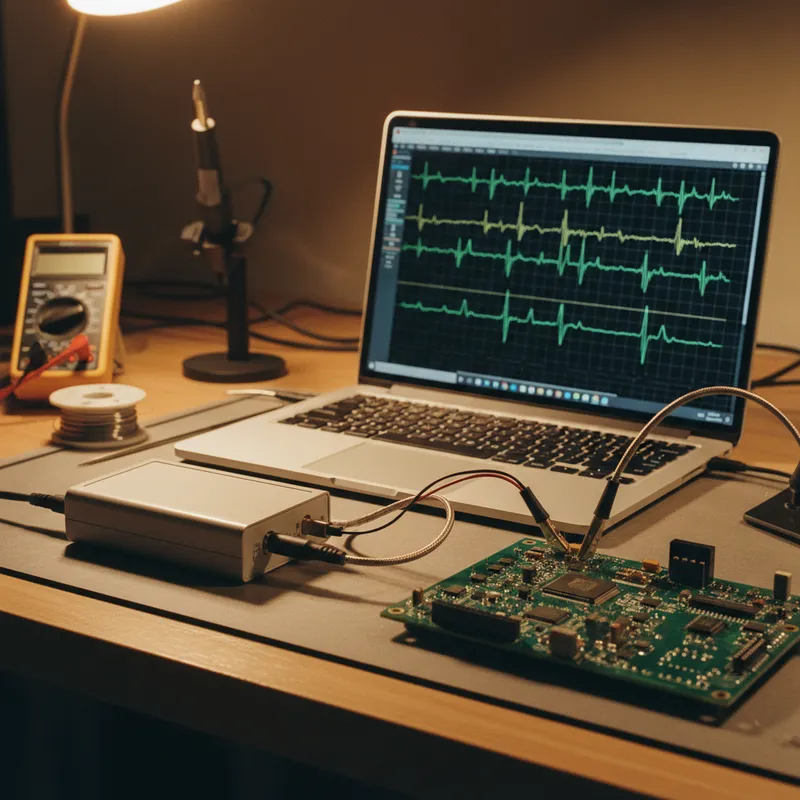
PicoScope oscilloscopes, particularly the PicoScope 6000E with its 500 MHz bandwidth and deep memory, provide the measurement capability needed for signal integrity characterization at a fraction of traditional benchtop costs.
Eye Diagram Analysis
An eye diagram is constructed by overlaying many consecutive unit intervals (UIs) of a digital signal on top of each other. The resulting display shows the statistical distribution of signal transitions, revealing:
- Eye opening height: The voltage margin between logic levels, larger is better
- Eye opening width: The timing margin for valid data sampling, wider is better
- Crossing point: Where signal transitions intersect, should be symmetric for balanced rise and fall times
- Jitter: Horizontal spread at the crossing point, less is better
Building Eye Diagrams with PicoScope
PicoScope 7’s persistence display mode constructs eye diagrams automatically:
- Set the timebase to one or two unit intervals of the signal under test
- Enable persistence mode, the software overlays successive acquisitions
- Use colour intensity grading to visualize the probability distribution of the signal
- The result is a standard eye diagram that shows signal quality at a glance
The 6000E’s deep memory (4 GS) allows thousands of unit intervals to be captured in a single acquisition, building statistically rich eye diagrams without waiting for many separate triggers.
Jitter Measurement
Jitter, the deviation of a signal edge from its ideal timing, is the primary timing threat in high-speed digital systems. PicoScope provides several jitter measurement methods:
Period Jitter
Measure the variation in clock period across many consecutive cycles:
- Capture a long record of the clock signal (thousands of cycles)
- Use PicoScope 7’s automatic measurement for period
- View the measurement statistics: mean, standard deviation, min, max
- The standard deviation of the period measurement is the RMS period jitter
Cycle-to-Cycle Jitter
The difference in period between consecutive clock cycles, a measure of short-term timing instability:
- Export period measurements for consecutive cycles
- Calculate the first difference (period_n+1 - period_n)
- The standard deviation of this difference is the cycle-to-cycle jitter
Time Interval Error (TIE)
TIE measures each edge’s deviation from an ideal reference clock:
- Capture the signal
- Define the ideal period from the measured average
- Calculate the cumulative timing error at each edge
- TIE jitter reveals both random and deterministic jitter components
Rise Time and Fall Time Measurement
Signal edge speed is a fundamental signal integrity parameter. Slower edges indicate bandwidth limitation, excessive capacitive loading, or impedance mismatch.
PicoScope 7 provides automated rise time and fall time measurements with configurable thresholds (10%-90% or 20%-80%, per industry standard). For statistical analysis:
- Capture thousands of transitions using deep memory
- View the distribution of rise/fall times
- Identify outliers that may indicate intermittent signal integrity problems
Bandwidth Considerations
To accurately measure a signal’s rise time, the oscilloscope must have sufficient bandwidth. The rule of thumb: scope bandwidth should be at least 3–5x the signal’s bandwidth (which is approximately 0.35 / rise_time for a single-pole system).
For a signal with 1 ns rise time, the required scope bandwidth is approximately 1–1.75 GHz. The PicoScope 6000E at 500 MHz accurately measures rise times down to approximately 2 ns, suitable for many LVDS, SPI, and I2C signal integrity measurements.
For faster edges (USB 3.0, HDMI, PCIe), the PicoScope 9300 sampling oscilloscope provides bandwidth up to 25 GHz through equivalent-time sampling.
Pre-Compliance Testing
Before submitting a product for formal compliance testing at an accredited lab, a process that in India typically costs Rs 2–5 lakh per test cycle, engineers can perform pre-compliance testing in-house using PicoScope.
Clock Signal Quality
Verify clock signals meet specifications for frequency accuracy, duty cycle, jitter, and harmonic content. The PicoScope’s FFT spectrum mode shows harmonics and spurs without needing a separate spectrum analyzer.
Impedance Validation with TDR
Using a fast edge signal (from a pulse generator) and the PicoScope’s sampling capability, time-domain reflectometry (TDR) measurements reveal impedance discontinuities along transmission lines. This is critical for verifying PCB trace impedance matches the design target (typically 50 ohm or 100 ohm differential).
Crosstalk Measurement
Capture the aggressor signal on one channel and the victim trace on another channel simultaneously. Measure the crosstalk amplitude and timing relationship. PicoScope’s multi-channel deep memory capture ensures both signals are time-correlated.
Application Context in India
India’s electronics hardware industry is designing increasingly complex boards, 5G base stations, EV battery management systems, industrial IoT gateways, satellite communication terminals, where signal integrity is a design-critical concern. R&D teams in Bengaluru, Hyderabad, Pune, and Chennai need practical signal integrity measurement tools that can be deployed quickly without the multi-crore investment of traditional signal integrity analysers.
Why Buy PicoScope from GSAS
GSAS Micro Systems is an authorized Pico Technology partner, providing PicoScope oscilloscopes and probes for signal integrity measurement.
- Probe selection guidance: passive probes, active probes, and differential probes matched to your signal bandwidth
- Demo units at offices in Bengaluru, Hyderabad, Chennai, Pune, Mumbai, and Delhi NCR
- INR invoicing with GST-compliant documentation
- Application engineering for signal integrity test setup
Also appears in:
Interested in Pico Technology tools?
Talk to our application engineers for personalized tool recommendations.
More from Pico Technology
View all →
How to Buy an Oscilloscope in India (2026): USB vs Benchtop, Bit Depth, Bandwidth: A Buying Guide
5 Jun · 11 min
PicoScope 5000D vs 5000E: Native 16-Bit or FlexRes? A Buyer's Guide for Indian Labs
4 Jun · 11 min
PicoScope 5000E in India: The World's First 4-Channel 16-Bit USB Oscilloscope, Explained
4 Jun · 11 min
PicoScope 7 Goes Native Arm64: Apple Silicon, Snapdragon Windows and Arm Linux Test Benches in India
4 Jun · 11 min

Emulating Processor Power for Thermal Testing: Why Constant Power
7 Oct · 7 min

CRPS and Rack Power Supply Testing: The Six Tests That Matter
7 Oct · 7 min