
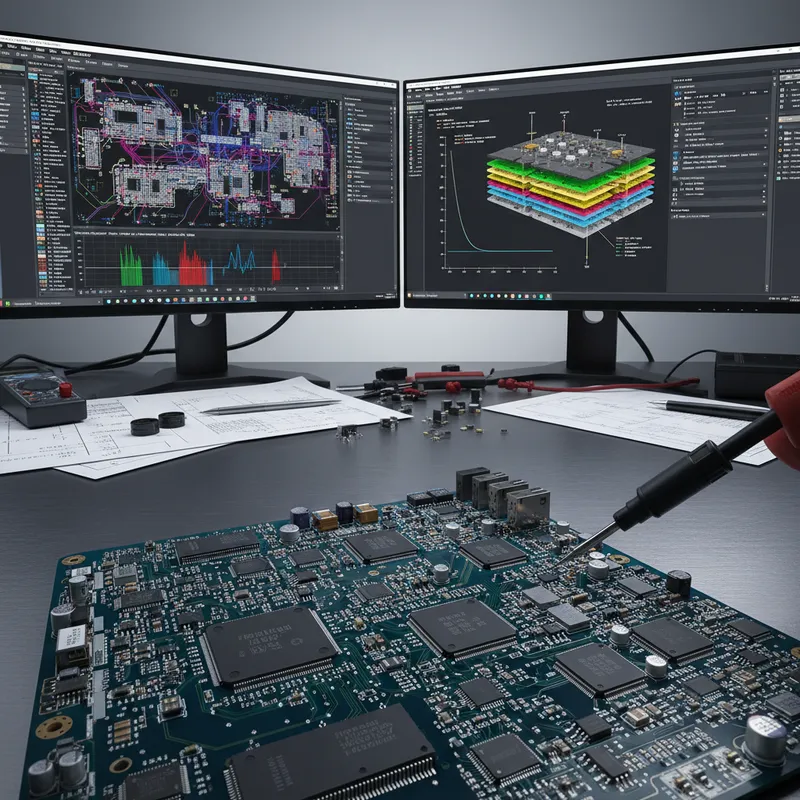
Every populated circuit board that arrives at a repair bench presents the same question: which component failed, and where? Schematics are often unavailable. Powering up a faulty board risks further damage. A multimeter gives one measurement at a time and cannot characterise complex impedance networks. The FADOS XI Advanced VI Analyzer from ProT Ar-Ge addresses all of these constraints, combining VI curve tracing, equivalent circuit diagram generation, and step-by-step 3D frequency scanning into a dual-channel diagnostic platform that works on unpowered boards without schematics.
FADOS stands for FAult Detector OScilloscope. This article covers VI curve tracing from first principles, explains how to read VI curves for every major component type, and walks through the FADOS XI’s frequency scanning feature, the capability that separates it from every other VI curve tracer on the market.
What Is VI Curve Tracing?
VI curve tracing is a non-powered testing technique where a controlled, current-limited AC signal is applied to a component or node on an unpowered PCB, and the resulting voltage-current characteristic curve is plotted on screen. The shape of the curve reveals what component is present and whether it is functioning correctly, without removing the component from the board and without needing a schematic.
The test is inherently safe: the stimulus signal is low-voltage and current-limited, the board remains completely unpowered, and there is no risk of further damage to an already-faulty board.
Every electronic component has a unique voltage-current relationship, its electrical fingerprint. A resistor, a capacitor, a diode, and a transistor each produce distinctly different VI curve shapes. When you compare the VI curve at a test point on a suspect board against the same point on a known-good reference board, any deviation immediately identifies the location and nature of the fault.
VI curve tracing is also called signature analysis or analog signature analysis (ASA). The technique dates to the 1970s, but modern implementations like FADOS add automatic component identification, equivalent circuit generation, frequency scanning, and database storage that make the method far more practical than early analog instruments.
How Do You Read VI Curves for Common Components?
Each component type produces a characteristic shape on the VI plot. Learning to recognise these shapes is the foundation of effective VI curve diagnosis.
| Component | VI Curve Shape | What to Look For |
|---|---|---|
| Resistor | Straight diagonal line | Slope indicates resistance value. Steeper line = lower resistance. Horizontal = open. Vertical = short. |
| Capacitor | Ellipse (oval) | Width indicates capacitance. A narrow ellipse close to the X axis = high-quality capacitor. Tilted ellipse = high ESR or leakage. |
| Inductor | Tilted ellipse (wider than capacitor) | Orientation is perpendicular to a capacitor’s ellipse at the same test frequency. Width indicates inductance. |
| Diode | Sharp 90-degree bend (hockey stick) | Forward conduction in one direction, blocking in the other. The knee position indicates forward voltage drop. |
| Zener diode | Bend in both directions | Forward knee at standard diode voltage; reverse knee at the Zener breakdown voltage. |
| Transistor (BJT) | Multi-segment curve | Base-emitter junction shows a diode curve. Base-collector shows a different diode curve. Collector-emitter may show leakage. |
| MOSFET / IGBT | Gate-source: capacitive ellipse | The gate oxide capacitance produces an elliptical shape. Drain-source shows the body diode in one polarity. |
| IC pins | Complex composite curve | Each pin shows the aggregate impedance of all internal structures connected to that pin. Compare against reference, deviations indicate internal IC failure. |
Resistors trace a straight line through the origin. The slope is set by the resistance value: under 10 ohms produces a nearly vertical line. Above 10 kilohms produces a nearly horizontal line. Open = horizontal (zero current). Short = vertical (zero voltage drop).
Capacitors produce an elliptical curve because current leads voltage by up to 90 degrees. Larger capacitance creates a wider ellipse. A high-quality capacitor traces a clean, symmetrical ellipse close to the X axis. A degraded capacitor’s ellipse tilts toward the resistive diagonal, the tilt quantifies ESR and leakage.
Inductors also produce ellipses, but rotated approximately 90 degrees relative to a capacitor’s ellipse at the same frequency, because inductor current lags voltage.
Diodes produce a sharp hockey-stick bend: rapid current increase above the forward voltage threshold (approximately 0.6 V for silicon, 0.3 V for Schottky), and flat in reverse until breakdown. Shorted = vertical line. Open = horizontal line.
On a populated board, the VI curve at any probe point represents the aggregate impedance of all components connected to that node. This is why comparison against a known-good reference works so well, you do not need to know individual component values, only whether the aggregate signature matches. For a deeper exploration of component signatures, see VI Curve Signature Analysis, Reading Component Fingerprints.
What Is the FADOS Equivalent Circuit Diagram Feature?
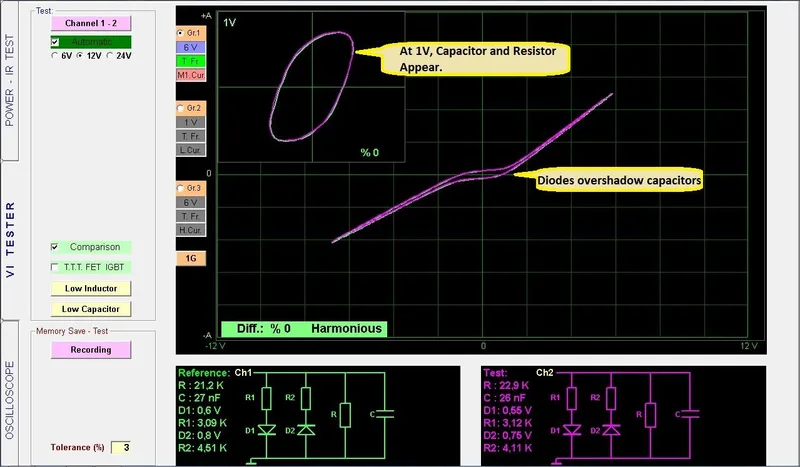
The FADOS equivalent circuit diagram is an automatically generated schematic that shows the equivalent resistor-capacitor-inductor-diode (R/C/L/D) network at every probe point, with measured component values displayed alongside the diagram. Unlike a multimeter, which gives one measurement at a time and cannot separate parallel components, FADOS shows all parallel and series components simultaneously.
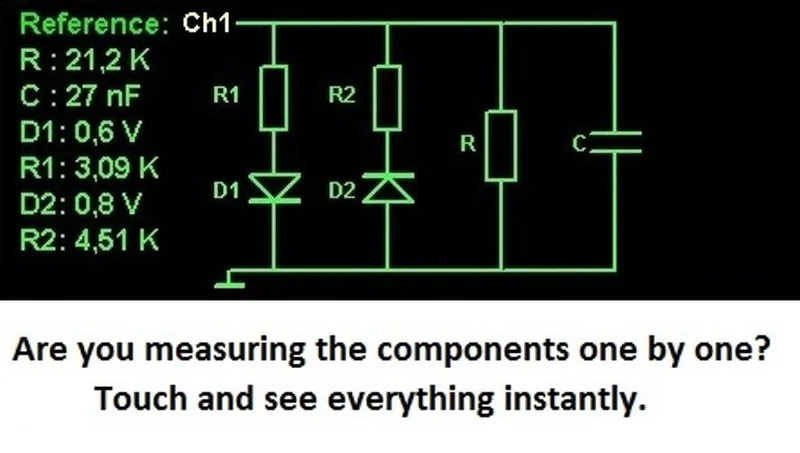
This matters because real PCB nodes are rarely simple. A decoupling capacitor on a power rail may have a parallel leakage path through a semiconductor junction, series trace resistance, and parasitic inductance from vias. A multimeter measuring capacitance at this point gives a misleading reading because the parallel resistance defeats the measurement. FADOS decomposes the node into its constituent R, C, L, and D elements and displays each value separately.
The equivalent circuit updates in real time as the probe moves. If the reference shows 100 nF in parallel with 4.7 kilohms, and the test point shows 100 nF in parallel with 220 ohms, the technician immediately identifies a low-resistance leakage path, likely a partially shorted semiconductor or a degraded capacitor.
What Is Step-by-Step Frequency Scanning on the FADOS XI?
Step-by-step frequency scanning is a FADOS XI exclusive feature that sweeps the test frequency across a defined range, either 50-1250 Hz or 100-2500 Hz, in controlled incremental steps, and builds a 3D visualisation of how the VI curve evolves with frequency. The result is a three-dimensional surface where the X axis is voltage, the Y axis is current, and the Z axis (depth) is frequency.
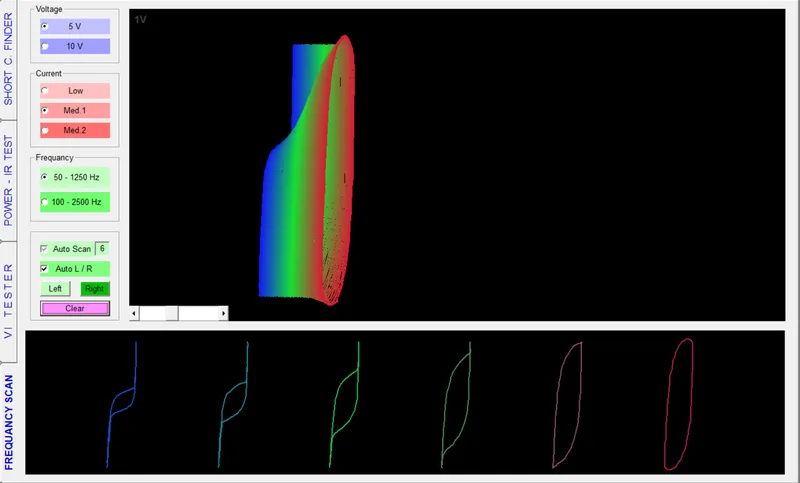
Standard VI curve tracing tests at a single frequency. This works for most faults, but has a blind spot: frequency-dependent components, capacitors, inductors, resonant networks, may behave normally at one frequency but reveal faults at another. A dried-out electrolytic capacitor may pass a 100 Hz test but fail at 1000 Hz where its degraded ESR dominates.
The frequency scan eliminates this blind spot:
- Connect probes. Place Channel 1 on the known-good reference board and Channel 2 on the suspect board, both at the same test point.
- Select frequency range. Choose 50-1250 Hz for general-purpose scanning or 100-2500 Hz for finer resolution on higher-frequency behaviour.
- Start the scan. The FADOS XI automatically steps through the frequency range, acquiring a VI curve at each step.
- View the 3D result. The software assembles all captured VI curves into a 3D surface that can be rotated, zoomed, and compared between channels.
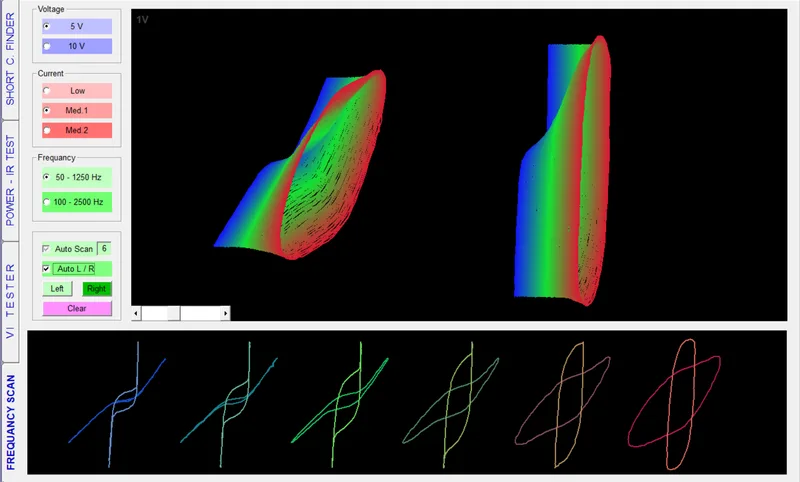
- Compare channels. The reference board’s 3D surface and the test board’s 3D surface are displayed side by side. Any difference in shape, volume, or orientation indicates a frequency-dependent fault.
The entire scan completes in seconds. The technician does not need to manually change frequencies or record intermediate results, the FADOS XI automates the sweep and presents the aggregated 3D view.
How Does 3D Frequency Scanning Help Find Faults?
The 3D frequency scan reveals four categories of faults that single-frequency VI testing can miss.
Dried-out electrolytic capacitors. An electrolytic capacitor that has lost electrolyte due to heat, age, or poor quality retains some capacitance at low frequencies but shows dramatically increased ESR and reduced capacitance at higher frequencies. On the 3D scan, the VI curve ellipse shrinks and tilts as frequency increases, a healthy capacitor maintains a consistent ellipse shape across the frequency range.
Degraded ceramic capacitors. Class II ceramics (X7R, Y5V) lose capacitance with DC bias, temperature, and aging. The 3D scan reveals whether the impedance profile across frequency matches the reference, catching capacitors that have drifted out of specification.
Frequency-dependent parasitic paths. On dense boards, parasitic capacitance and inductance create frequency-dependent impedance paths. A contamination-induced leakage path might have minimal effect at 50 Hz but create a measurable shunt at 2000 Hz. The 3D scan makes these paths visible.
Resonance effects. LC networks (intentional or parasitic) have resonant frequencies where impedance reaches a minimum or maximum. A wrong-value replacement capacitor that shifts the resonant frequency shows up clearly in the 3D scan.
How Do You Test Capacitor Quality with FADOS?
FADOS provides a direct, visual method for assessing capacitor quality without desoldering the component from the board.
A high-quality capacitor produces a VI curve that is an ellipse oriented close to the X axis, the current leads the voltage by nearly 90 degrees, and the resistive (ESR) component is negligible. The closer the ellipse is to a perfect circle centred on the X axis, the better the capacitor.
A degraded capacitor, one with elevated ESR, reduced capacitance, or internal leakage, produces an ellipse that is tilted toward the diagonal (resistive axis). The degree of tilt directly quantifies the capacitor’s quality: more tilt means more resistive loss, which means a lower-quality capacitor.
This is particularly useful for electrolytic capacitor assessment:
- New, healthy electrolytic: Wide ellipse, nearly horizontal orientation, symmetrical shape
- Aged but functional electrolytic: Slightly narrower ellipse, minor tilt toward diagonal
- Degraded electrolytic (replacement needed): Noticeably narrower ellipse, significant tilt, possible asymmetry
- Failed electrolytic: Ellipse collapses toward a straight line (approaching pure resistance), or curve shows erratic behaviour
The frequency scan adds another dimension: a healthy electrolytic maintains its elliptical shape across the 50-2500 Hz range, while a degraded electrolytic shows its ellipse collapsing at higher frequencies, the behaviour behind ripple rejection failures and voltage regulator instability.
The equivalent circuit diagram complements this by showing the measured capacitance, parallel resistance (leakage), and series resistance (ESR) as separate values that can be compared directly against datasheet specifications.
How Does the FADOS Dual-Channel Comparison Workflow Operate?
The FADOS dual-channel comparison workflow is the primary diagnostic method for PCB fault isolation. Channel 1 connects to a known-good reference board. Channel 2 connects to the board under test. Both channels display their VI curves simultaneously, overlaid or side by side.
The workflow proceeds as follows:
- Set up reference board. Connect Channel 1 probes to a known-good board of the same type. Clip the ground lead to a common ground point.
- Set up test board. Connect Channel 2 probes to the suspect board. Clip the ground lead to the corresponding ground point.
- Probe matching points. Touch the Channel 1 and Channel 2 probe tips to the same test point on their respective boards. The FADOS software instantly displays both VI curves overlaid.
- Listen for audio feedback. FADOS generates an audio tone that reflects the degree of match between the two channels. A matching tone indicates the test point is good. A discordant tone indicates a deviation. This allows the technician to probe rapidly without constantly watching the screen.
- Identify deviations. When the two VI curves do not match, the software calculates a percentage difference and classifies the point as Harmonious (match), Attention (marginal), or Disharmony (fault confirmed).
- Record the fault. The technician marks the faulty point on a board photograph within the FADOS software. The VI curve data, equivalent circuit values, and probe location are saved to the project database.
The percentage difference calculation is automatic and the three-level classification provides a clear go/no-go decision at every test point. Combined with audio feedback, an experienced technician can probe 50-100 points per minute, listening for the discordant tone and only stopping to investigate flagged points.
How Do Memory Recording and Board Photography Work?
FADOS stores reference VI curves, equivalent circuit data, and frequency scan results in a database linked to a photograph of the board. Each probe point is marked on the photograph with its associated test data, enabling two workflows:
Stored-reference comparison. Once a known-good board has been fully characterised, the physical reference board is no longer needed. Future suspect boards are compared against the stored data. This is essential for legacy boards where only one working unit exists, or for high-value boards that cannot be tied up as a reference.
Guided probing. A senior technician creates a test sequence by marking probe points on the board photo in order, power rails first, then clock circuits, then signal paths. A junior technician follows the sequence, with the FADOS software showing the expected reference curve at each step. This turns board diagnosis into a repeatable, documented procedure.
Fault reports export as Excel spreadsheets and JPG images for warranty claims, quality investigations, and customer communication.
Why Does FADOS Outperform a Multimeter for PCB Diagnostics?
For technicians evaluating whether to upgrade from multimeter-based troubleshooting to a dedicated VI curve tracer, this is the direct comparison.
| Capability | Digital Multimeter | FADOS (VI Curve Tracer) |
|---|---|---|
| Measurements per probe point | 1 (resistance OR capacitance OR voltage, one at a time) | All simultaneously (R, C, L, D in equivalent circuit) |
| Parallel components | Cannot separate, gives misleading aggregate reading | Separates and displays each parallel element |
| Schematic required | Yes, must know expected values to judge pass/fail | No, compare against known-good reference board |
| Board power state | Some measurements require power (voltage, current draw) | Power-off testing standard; powered testing optional (FADOS XI, 9F1) |
| Speed | 30-60 seconds per measurement (select mode, range, record) | 1-2 seconds per point (probe, listen, move) |
| Frequency-dependent faults | Invisible, single-frequency measurement | Visible via 3D frequency scan (FADOS XI) |
| Documentation | Manual recording | Automatic database with board photos and fault reports |
| Training required | Moderate (must understand circuit theory to interpret readings) | Lower barrier (pattern matching against reference, deviation = fault) |
The core advantage is the workflow inversion. A multimeter requires the technician to hypothesise which component is faulty, then verify. FADOS inverts this: probe every point, let the reference comparison flag where faults are, then investigate only the deviations.
Where Is VI Curve Testing Used in India?
VI curve tracing with FADOS is deployed across multiple industries in India, addressing the common challenge of maintaining and repairing populated circuit boards without OEM support, schematics, or factory test equipment.
Automotive ECU repair. Workshops and OEM-authorised service centres use FADOS to diagnose failed engine control units, body control modules, instrument clusters, and infotainment head units. Automotive ECUs are produced in high volumes, so a known-good reference is readily available, ideal for dual-channel comparison.
Industrial maintenance. Manufacturing plants use FADOS to repair PLC modules, VFD control boards, servo amplifier boards, and HMI controllers. In continuous-process industries where downtime is measured in lakhs per hour, FADOS reduces board-level troubleshooting from hours to minutes.
Defence depot overhaul. Defence electronics maintenance facilities use FADOS for component-level repair of avionics, radar, and communication boards, often legacy designs with no remaining OEM support. The stored-reference capability is essential: characterise one working unit, and the data serves for all future repairs.
Laptop and consumer electronics repair. High-volume operations servicing laptops, gaming consoles, and LED televisions use FADOS to standardise diagnosis across technician teams via the guided-probing workflow.
Medical device service. Biomedical engineers maintaining patient monitors, infusion pumps, and diagnostic imaging equipment use FADOS for in-house board repair, avoiding expensive OEM service contracts.
Where Can You Buy FADOS XI in India?
GSAS Micro Systems is an authorized ProT Ar-Ge engineering partner for India, providing the full FADOS product family with INR invoicing under GST, local inventory, application training, and on-site installation support.
The FADOS product line includes:
- FADOS XI Advanced VI Analyzer, the flagship with non-contact short circuit detection and 3D frequency scanning
- FADOS 9F1, dual-channel VI tracer with built-in power supply and IR thermal sensor
- FADOS 7F1, portable dual-channel VI tracer for field service
- FADOS MUX, 100-point multiplexer for automated production-line testing
Contact GSAS for a hands-on demonstration at any of our offices in Bengaluru, Hyderabad, Chennai, Pune, Mumbai, or Delhi NCR.
Request a FADOS demo → | View all ProT Ar-Ge products →
Further Reading
GSAS resources
- VI Curve Signature Analysis, Reading Component Fingerprints on Unpowered Boards, deep dive into interpreting VI curves for every component type
- FADOS 9F1 Advanced Features, Powered Board Testing and IR Thermal Scanning, the powered testing and thermal scanning workflow
- FADOS 9F1 vs 7F1, Which Circuit Board Tester Is Right for Your Workshop?, feature comparison and selection guide
- PCB Repair Guide, Shorted Capacitors and VI Tracing, applied example of using VI curves for capacitor faults
External references
- ProT Ar-Ge, FADOS Product Family, official OEM product pages, datasheets, and application notes
- IPC standards catalogue (Global Electronics Association), home of IPC-7711/7721, the industry standard for PCB rework, modification, and repair procedures
Also appears in:
Interested in ProT Ar-Ge tools?
Talk to our application engineers for personalized tool recommendations.
More from ProT Ar-Ge
View all →
FADOS Test Reports and GSAS Agent: Turning Board Test Results into an Auditable Record
4 Aug · 8 min

FADOS Circuit Board Tester: Complete Guide for Indian Repair Teams
16 Apr · 13 min
FADOS XI Non-Contact Short Circuit Detection: Find PCB Shorts in Seconds
16 Apr · 9 min

The Economics of Board-Level Repair in India: Why More Workshops Are Investing in Diagnostics
5 Apr · 7 min

Emulating Processor Power for Thermal Testing: Why Constant Power
7 Oct · 7 min

CRPS and Rack Power Supply Testing: The Six Tests That Matter
7 Oct · 7 min