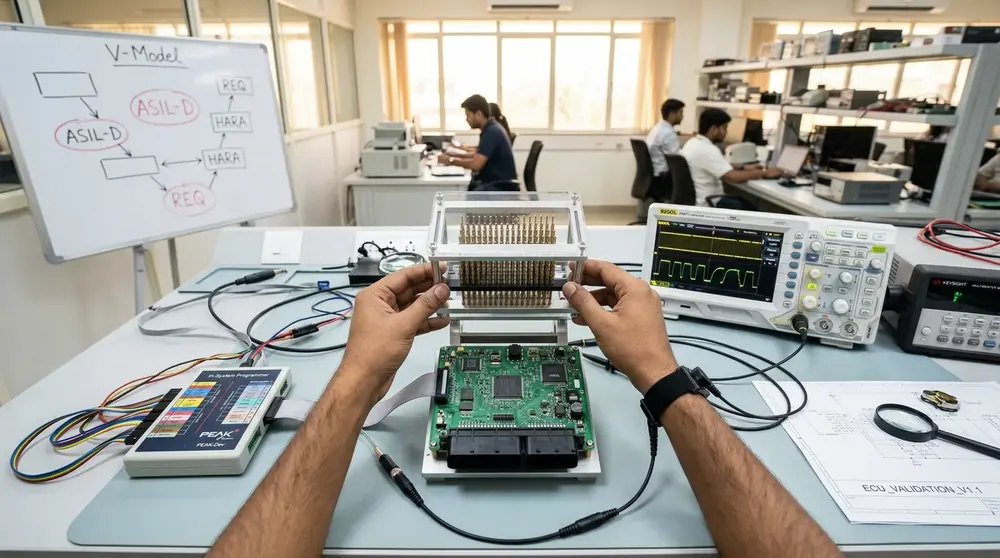
The BGA Diagnostic Challenge
Ball Grid Array (BGA) packages dominate modern electronics, processors, FPGAs, DDR memory, chipsets, and high-density ASICs all use BGA packaging for their superior electrical performance and compact footprint. But the solder balls that connect a BGA to the PCB are hidden beneath the package, invisible to visual inspection.
When BGA solder joints fail, through thermal cycling fatigue, mechanical stress, moisture absorption, or manufacturing defects, the symptoms are often intermittent and difficult to localize. The board may boot inconsistently, crash under thermal stress, or exhibit data corruption that points to the BGA but cannot be confirmed without destructive analysis or X-ray inspection.
X-ray inspection is the gold standard for BGA solder joint evaluation, but X-ray equipment costs Rs 30–80 lakh and requires specialized operator training. For repair workshops and service centres that cannot justify that investment, VI curve tracing provides a practical alternative.
How VI Curves Reveal BGA Faults
Every BGA ball connects to a specific circuit node, a power pin, ground pin, signal pin, or no-connect pad. Each of these nodes has a characteristic VI curve signature determined by the components and traces connected to it.
Open Ball Faults
When a solder ball loses contact (open circuit), the VI curve for that pin changes from its expected signature to a flat horizontal line (infinite impedance). By probing the corresponding via or trace pad on the PCB side and comparing against a known-good reference, open ball faults produce unmistakable signature deviations.
Bridged Pin Faults
When adjacent solder balls bridge together (solder short), the VI curve for each affected pin changes because the two circuit nodes are now electrically connected. The merged signature shows characteristics of both nodes superimposed.
Cold Joint / High-Resistance Faults
A cold or cracked solder joint creates an intermittent high-resistance connection. The VI curve shows a modified slope, resistive rather than the expected reactive or semiconductor signature. These faults may be subtle but are consistently detectable when compared against a golden reference.
Practical Workflow
Equipment
- FADOS 9F1, preferred for BGA diagnostics due to its built-in power supply and IR thermal scanning
- Fine-pitch probes or probe adapter for accessing BGA breakout vias
- Known-good reference board (or previously stored golden signatures)
Step 1: Map Accessible Test Points
Most BGA PCB designs include test vias or breakout pads that provide access to individual BGA balls from the opposite side of the board. Identify these points using the board’s test point documentation or by visual inspection under magnification.
For boards without dedicated test points, accessible traces that route from BGA pads to other components or connectors can serve as alternative probe points.
Step 2: Build the Reference
Using a known-good board, record VI curve signatures at each accessible BGA-related test point. The FADOS software stores these as a reference database. For common board types, this reference only needs to be built once and can be reused for all subsequent boards of the same design.
Step 3: Compare Against Reference
Mount the suspect board and probe each test point sequentially. The FADOS software overlays the measured curve against the stored reference, highlighting any deviations.
- Open ball: Measured curve shows flat (infinite impedance) where reference shows normal signature
- Bridge: Two test points show identical merged signatures instead of their distinct individual signatures
- Cold joint: Measured curve shows resistive slope offset from the reference signature
Step 4: Thermal Confirmation (FADOS 9F1 Only)
For suspected cold joints or intermittent connections, the 9F1’s powered testing capability adds confirmation:
- Apply low voltage through the built-in power supply with current limiting
- A high-resistance solder joint dissipates more power than a healthy joint
- Use the IR thermal sensor to scan the BGA area
- Anomalously warm spots under or around the BGA indicate stressed joints
This thermal method works because heat generated at a faulty solder ball conducts through the BGA package and is detectable from the top surface.
Step 5: Rework Decision
With fault type and location identified, the repair technician can make an informed rework decision:
- Open or cold joints: BGA reballing or reflow may restore the connection
- Bridged pins: Targeted reflow with flux can clear the bridge
- Systemic failures (multiple opens): Full BGA replacement is typically required
Advantages Over X-Ray
VI curve analysis does not replace X-ray inspection for manufacturing quality control where 100% coverage is needed. But for repair and service environments, it offers practical advantages:
- Equipment cost: A FADOS 9F1 costs a fraction of an X-ray system
- Operator training: VI curve interpretation requires less specialized training than X-ray image analysis
- Throughput: For targeted diagnostics (not 100% inspection), VI tracing is faster
- Portability: The FADOS 9F1 can be deployed at field service locations where X-ray equipment is impractical
Why Buy FADOS from GSAS
GSAS Micro Systems is an authorized ProT Ar-Ge partner and ODM assembler. Our engineers in Bengaluru can help you develop BGA test procedures and reference databases for your specific board types.
Service and support across India, Bengaluru, Hyderabad, Chennai, Pune, Mumbai, Delhi NCR, and Visakhapatnam.
- INR invoicing with GST-compliant documentation
- Application engineering for complex diagnostics
- Training covering power-off VI testing, powered board diagnostics, and thermal scanning
Also appears in:
Interested in ProT Ar-Ge tools?
Talk to our application engineers for personalized tool recommendations.
More from ProT Ar-Ge
View all →
FADOS Test Reports and GSAS Agent: Turning Board Test Results into an Auditable Record
4 Aug · 8 min

FADOS Circuit Board Tester: Complete Guide for Indian Repair Teams
16 Apr · 13 min

FADOS XI Frequency Scanning and VI Curve Tracing for PCB Diagnostics
16 Apr · 11 min
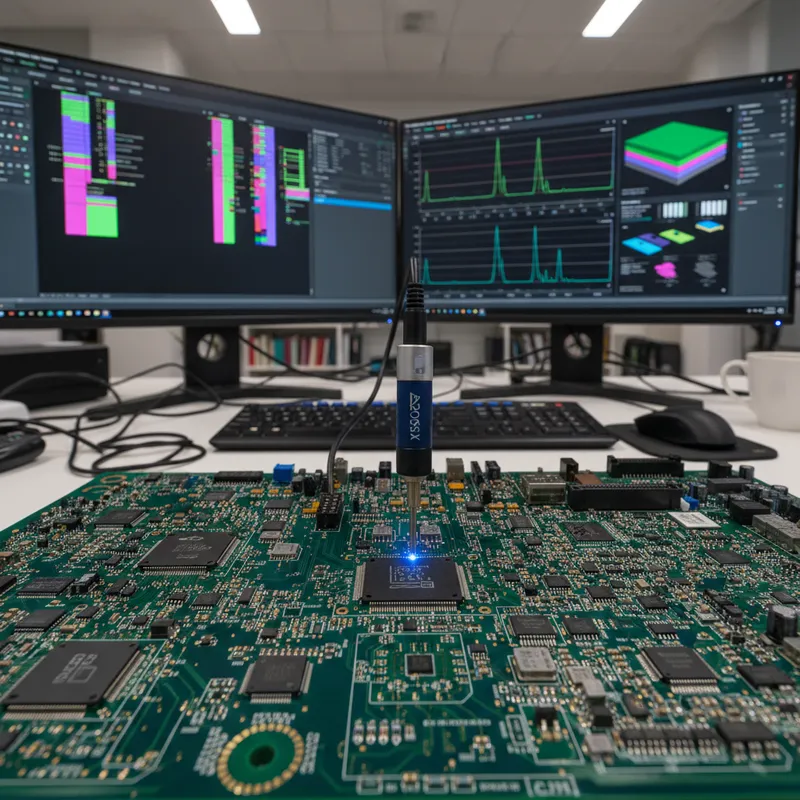
FADOS XI Non-Contact Short Circuit Detection: Find PCB Shorts in Seconds
16 Apr · 9 min

Emulating Processor Power for Thermal Testing: Why Constant Power
7 Oct · 7 min

CRPS and Rack Power Supply Testing: The Six Tests That Matter
7 Oct · 7 min