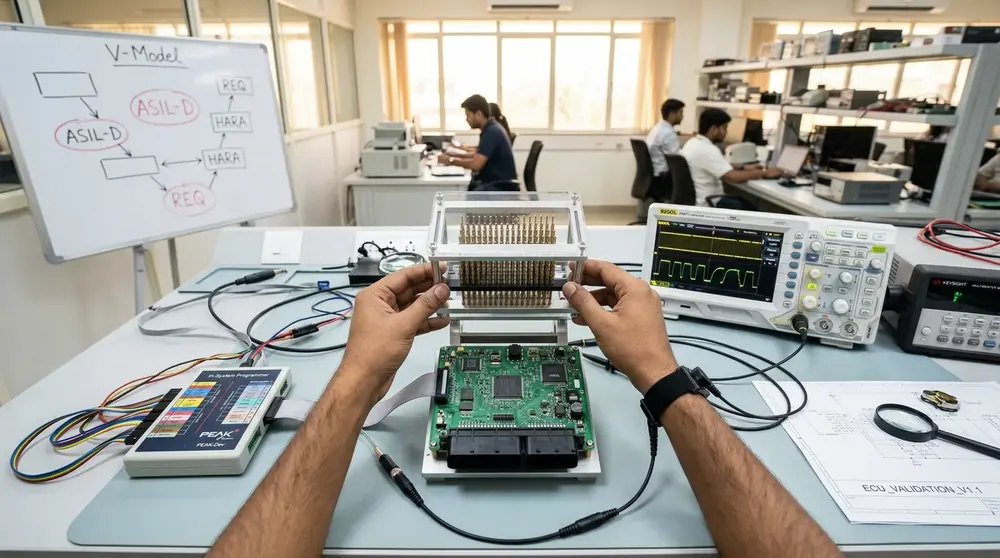
Finding a defect in month 2 instead of month 14 is a budget decision before it is a quality decision. This page sets out what the published evidence actually supports, what it does not, and how Indian embedded teams build the case using their own numbers.
Month 2 or Month 14: the same defect, a different invoice
A null pointer dereference in a CAN handler is the same three lines of code whether you find it in the second month of a programme or the fourteenth. What changes is everything attached to it.
In month 2 the fix is a code change, a re-run of the unit test suite, and a coverage report regenerated overnight. In month 14 the same three lines sit underneath a frozen software release, a signed-off integration test campaign, a set of MC/DC coverage reports filed as certification evidence, a requirements traceability matrix, a supplier release note, and in an automotive or aerospace programme, an assessor who has already reviewed the artefacts you are about to invalidate.
This is why verification spend is an economic argument and not a process argument. Nobody in an Indian embedded team disputes that testing is good. What gets disputed, in every budget conversation, is whether the tool licence and the engineering time are worth committing in month 2 when the programme has not yet felt any pain. The honest answer is that the escalation is real, it is documented, and the single round multiplier it usually gets reduced to is routinely overstated. Both halves of that sentence matter, so this page deals with both.
What the published evidence actually supports
The most useful primary source is still the NIST planning report prepared by RTI, The Economic Impacts of Inadequate Infrastructure for Software Testing (NIST Planning Report 02-3, May 2002, prepared for Gregory Tassey at NIST). Its Table 1-5, “Relative Costs to Repair Defects when Found at Different Stages of the Life-Cycle”, reproduces two separate datasets rather than one round number:
| Life cycle stage | Baziuk (1995) | Boehm (1976) |
|---|---|---|
| Requirements | 1X | 0.2Y |
| Design | 0.5Y | |
| Coding | 1.2Y | |
| System testing | 90X | 5Y |
| Installation testing | 90X to 440X | 15Y |
| Acceptance testing | 440X | |
| Operation and maintenance | 470X to 880X |
The table carries a footnote on the operation and maintenance row reading “Possibly as high as 2,900X if an engineering change order is required.”
Read it carefully and it says something more defensible than a single multiplier. The Boehm column puts the ratio from requirements to installation testing at roughly 75 to 1. The Baziuk column, which the report’s own footnote ties to the cost of a hardware line card return in telecommunications, is an order of magnitude steeper again once a product is in service. Two studies, two domains, two very different slopes, and both of them steep. Neither column is segmented by criticality or by certification regime, which is worth remembering before either one is quoted as an embedded or safety figure.
The same report puts the national annual cost of an inadequate software testing infrastructure to the United States economy at “$59.5 billion”, split as $21.2 billion borne by software developers and $38.3 billion by software users, with “$22.2 billion” identified as the potential cost reduction from feasible infrastructure improvements. The report frames those as about 0.6 percent and 0.2 percent of the then $10 trillion US GDP.
The second source worth citing directly is Barry Boehm and Victor Basili, “Software Defect Reduction Top 10 List”, IEEE Computer, January 2001. Item one reads, verbatim:
“Finding and fixing a software problem after delivery is often 100 times more expensive than finding and fixing it during the requirements and design phase.”
Item two is the one that deserves more attention than it gets, because it describes where the money is actually going today rather than a ratio between two phases:
“Current software projects spend about 40 to 50 percent of their effort on avoidable rework.”
Boehm and Basili define avoidable rework as “effort spent fixing software difficulties that could have been discovered earlier and fixed less expensively or avoided altogether”. Item three adds that “About 80 percent of avoidable rework comes from 20 percent of the defects”, which is the practical reason defect triage and risk-based test selection pay for themselves.
And what the evidence does not support
If you have sat through a software quality presentation in Bengaluru or Pune, you have seen the chart: a smooth exponential curve, usually attributed to the “IBM Systems Sciences Institute”, in which a defect costs one unit to correct in design, 6.5 units just before testing begins, 15 units during testing, and between 60 and 100 units after release. We are not going to show you that chart, because it does not survive contact with its own sources.
The trail was followed by Hillel Wayne, and on the provenance of the figures by Laurent Bossavit, and reported by Tim Anderson in The Register on 22 July 2021, under the headline “Everyone cites that ‘bugs are 100x more expensive to fix in production’ research, but the study might not even exist”. The article’s finding is blunt: “There’s one tiny problem with the IBM Systems Sciences Institute study: it doesn’t exist.”
Bossavit’s published trawl traces the ratios to Roger Pressman’s software engineering textbook, whose cited reference is not a study at all but “‘Implementing Software Inspections,’ course notes, IBM Systems Sciences Institute, IBM Corporation, 1981”. His two stated findings are that the Institute “was a corporate training program, not a research body; as such it is inappropriate to cite the source of the ratios as ‘an IBM study’”, and that “the original project data, if any exist, are not more recent than 1981, and probably older; and could be as old as 1967”. He also documents that the Institute was based in Los Angeles and had stopped operating under that name before 1982. A set of undated course notes from a corporate training programme is not a dataset, and it is certainly not a dataset about modern embedded software.
Boehm and Basili themselves qualified the 100x figure in the same 2001 article that stated it. They added the word “often” deliberately, and wrote:
“One insight shows the cost-escalation factor for small, noncritical software systems to be more like 5:1 than 100:1.”
They went further, noting that “good architectural practices can significantly reduce the cost-escalation factor even for large critical systems” by confining most fixes to small, well encapsulated modules.
That qualification is the most commercially useful sentence in the whole literature, and it points in a direction that suits our customers rather than away from them. The escalation is mild for small, non-critical software. It is severe for large critical systems, which is Boehm and Basili’s own category, and our reading is that an Indian Tier 1 automotive supplier, an avionics LRU house or a medical device team sits squarely inside it. If you are building a web dashboard, the sceptics are right and you should not buy a verification toolchain on the strength of a curve. If you are building something that carries an ASIL or a DAL, the curve understates your exposure, because it prices only the rework and not the evidence.
Finding and fixing defects is the largest single line item
There is a second way to frame the economics that avoids the multiplier argument entirely: stop asking what a late defect costs relative to an early one, and ask what share of the programme budget defect work consumes in total.
The Consortium for Information and Software Quality puts that share plainly. In The Cost of Poor Software Quality in the US: A 2022 Report (Herb Krasner, CISQ, November 2022), the report states:
“The cost of finding and fixing deficiencies is the largest single expense element in the software development lifecycle. Over a 25-year life expectancy of a large software system, almost fifty cents out of every dollar will go to finding and fixing bugs.”
The same report estimates that “the cost of poor software quality in the US has grown to at least $2.41 trillion” and that accumulated software technical debt has grown to approximately $1.52 trillion.
Half of the lifetime cost of a large, long lived software system goes to defect work. That number is not a multiplier and it does not depend on a disputed 1981 chart. It simply says that defect work is the main event, and that anything which shifts defect discovery earlier is acting on the largest line in the budget rather than a marginal one.
CISQ measures US software generally and makes no embedded-specific claim, so the extension to embedded work is ours rather than theirs. Our reading is that a certified embedded programme sits at the harder end of that average rather than the easier one, because a late fix there obliges you to rebuild the evidence package alongside the code. The next two sections set out why.
Why no single technique closes the gap
The next question a programme manager asks is fair: if we already run unit tests, why buy static analysis as well, or the other way round?
Capers Jones published defect removal efficiency ranges by method in Software Defect Removal Efficiency (Capers Jones & Associates LLC, 2011). Defect removal efficiency, DRE, is the percentage of total defects a given method finds and removes before delivery. His Table 2 is reproduced in full below, pre-test methods first:
| Pre-test defect removal | Minimum | Average | Maximum |
|---|---|---|---|
| Formal design inspections | 65.00% | 87.00% | 97.00% |
| Formal code inspections | 60.00% | 85.00% | 96.00% |
| Static analysis | 65.00% | 85.00% | 95.00% |
| Formal requirement inspections | 50.00% | 78.00% | 90.00% |
| Pair programming | 40.00% | 55.00% | 65.00% |
| Informal peer reviews | 35.00% | 50.00% | 60.00% |
| Desk checking | 25.00% | 45.00% | 55.00% |
| Average | 48.57% | 69.29% | 79.71% |
And the test methods, again as Jones lists them, in descending order of average:
| Test defect removal | Minimum | Average | Maximum |
|---|---|---|---|
| Experiment-based testing | 60.00% | 75.00% | 85.00% |
| Risk-based testing | 55.00% | 70.00% | 80.00% |
| Security testing | 50.00% | 65.00% | 80.00% |
| Subroutine testing | 27.00% | 45.00% | 60.00% |
| System testing | 27.00% | 42.00% | 55.00% |
| External Beta testing | 30.00% | 40.00% | 50.00% |
| Performance testing | 30.00% | 40.00% | 45.00% |
| Supply-chain testing | 20.00% | 40.00% | 47.00% |
| Cloud testing | 25.00% | 40.00% | 55.00% |
| Function testing | 33.00% | 40.00% | 55.00% |
| Unit testing (automated) | 20.00% | 40.00% | 50.00% |
| Unit testing (manual) | 15.00% | 38.00% | 50.00% |
| Regression testing | 35.00% | 35.00% | 45.00% |
| Independent verification | 20.00% | 35.00% | 47.00% |
| Clean-room testing | 20.00% | 35.00% | 50.00% |
| Acceptance testing | 15.00% | 35.00% | 40.00% |
| Independent testing | 15.00% | 35.00% | 42.00% |
| Average | 29.24% | 44.12% | 55.06% |
Jones states the conclusion directly in the abstract of the same paper:
“High levels of DRE cannot be achieved using testing alone. Pre-test inspections and static analysis are necessary to top 95% in defect removal efficiency.”
Read the two tables side by side and the architecture of a verification budget falls out of the data. Exactly one test stage in Jones’s list averages above 70 percent on its own, experiment-based testing at 75 percent, and risk-based testing reaches 70 exactly; across all seventeen test stages the average is 44.12 percent. The pre-test group averages 69.29 percent, and static analysis alone averages 85 percent while running before a single test case executes. Neither class of technique is sufficient alone, and the two find different populations of defect: static analysis is strong against coding defects that are visible in the source, while dynamic unit test is the only thing that tells you what the code actually does on the target when the branch is taken.
Boehm and Basili’s item six supports the same conclusion from a different dataset: peer review “catches from 31 to 93 percent of the defects, with a median of around 60 percent”. A 60 percent median, achieved by people reading code, before any tool runs. Review, static analysis and dynamic test are additive, and the programmes that reach the high nineties run all three.
In a certified programme, a late defect costs more than the rework
Everything above is generic software economics. In a programme working to a functional safety or cybersecurity standard, there is a second cost layer that the published cost curves do not price at all, because they were derived from general software projects rather than certified ones.
When a defect is found after a verification campaign has completed, the code change is usually the cheapest part of the response. What follows is the expensive part:
- Coverage evidence is invalidated. Structural coverage results, including MC/DC where the integrity level calls for it, were measured against the previous binary. They are now measurements of software you are not shipping.
- Regression scope has to be justified, not guessed. An assessor wants an impact analysis that says which tests were re-run and why the ones you did not re-run were unaffected. That argument takes engineering time to construct and review.
- Traceability has to be re-established. Requirements to design to code to test links are part of the evidence package, and a late change edits that graph rather than appending to it.
- The assessor dialogue reopens. A change to a component that has already been reviewed is not free even when the change itself is small.
- Schedule risk becomes commercial risk. In automotive programmes the software release is gated to a vehicle milestone. In aerospace it is gated to a certification plan. Slipping either is not a line item in an engineering budget.
This is the structural reason a late defect is more expensive in certified work than in general software, and it is consistent with what Boehm and Basili said about large critical systems. GSAS covers the standard-by-standard detail on our compliance pages, in plain engineering terms rather than clause citations: ISO 26262 for automotive, IEC 61508 for industrial, DO-178C for airborne software, MISRA and AUTOSAR for coding standard conformance, UNECE R155 and R156 for vehicle cybersecurity and software update management, and the EU Cyber Resilience Act for connected products entering the European market.
The toolchain GSAS supplies to move discovery left
GSAS Micro Systems is an engineering partner, and the tools below are ones our engineers deploy, configure and use on customer programmes across India rather than a catalogue we forward.
Static analysis, before a test case runs. Perforce QAC is the standards-compliance analyser, with dedicated C and C++ parsers and inter-procedural dataflow analysis. Per Perforce, it is certified by TUV SUD for safety-related software development across IEC 61508, ISO 26262, EN 50716, IEC 60880 and IEC 62304, and it ships with the qualification kits an assessor will ask for. Perforce Klocwork covers the security-facing checkers, CERT C and the CWE weakness classes, with differential analysis suited to per-commit CI gating. GSAS is the authorized Perforce engineering partner across India, which covers both analysers.
Dynamic unit and integration test, with the coverage the standard expects. TESSY from Razorcat automates the three most labour-intensive parts of embedded testing, interface analysis, test driver generation and stub creation, and measures statement, branch, decision, MC/DC and multiple condition coverage. Razorcat states that TESSY “is qualified for safety-related software development according to IEC 61508, IEC 62304, ISO 26262 and EN 50128”, and supplies a Tool Qualification Package documenting the validation activities behind it. Per Razorcat, the Classification Tree Editor supports systematic and traceable test design, which is the difference between test cases you wrote and test cases you can defend.
On-target coverage without instrumentation overhead. Coverage measured on a host simulation is not the same evidence as coverage measured on the target. The Arm ULINKpro debug probe captures ETM instruction trace from the running target, non-intrusively, and Arm publishes its coverage output in gcov format for statement and branch coverage. MC/DC and the qualified coverage evidence come from the analyser that consumes the trace, such as TESSY, not from the probe itself; the probe is not safety-qualified, and qualification flows through the analyser. GSAS is the authorized Arm development tools engineering partner for India.
Compiler choice as a verification decision. Arm Compiler for Embedded FuSa is the separately licensed safety-qualified variant of Arm Compiler 6; the standard compiler is not itself qualified. Per Arm, qualified releases of the FuSa compiler are certified by TUV SUD to ISO 26262 ASIL D, IEC 61508 SIL 3, EN 50716 SIL 4 and IEC 62304 Class C, and ship with a Qualification Kit containing the Safety Manual, Test Report and Defect Report that documents known compiler anomalies. Certification attaches to specific qualified releases rather than to every release, so the release you plan to certify against is worth confirming before you plan around it. Having the anomalies documented removes one argument from the safety case that is otherwise expensive to make from first principles.
The service wrapper around these tools is described on Testing and Validation, and the safety lifecycle work they feed into, from hazard analysis through tool qualification to the safety case, on Functional Safety and Compliance.
Build the case on your own numbers, not on a borrowed multiplier
We will not hand you a multiplier and invite you to multiply your defect count by it. The published multipliers come from other people’s programmes in other decades, and a finance director is right to discount them.
What we will do is help you instrument your own programme so that the argument is made with your data. The measurements that matter are unglamorous and mostly already sitting in systems you own:
- Phase-tag every defect at the point of discovery. Your tracker almost certainly records when a defect was found. Make it record the lifecycle phase it was found in and, separately, the phase it was introduced in. Without those two fields no cost-of-late-discovery argument can ever be made from your own history.
- Record effort to close, not just count. A defect count is not a cost. Hours to close, including regression and re-review, is a cost. Boehm and Basili’s own advice is that a tracking system for software problem reports that records the effort to fix each defect “lets you analyze the data fairly easily to determine and address additional major sources of rework”.
- Measure defect removal efficiency per method. Count what static analysis caught before test, what unit test caught before integration, what integration caught before system test, and what escaped to the field. That single ratio tells you which stage of your pipeline is leaking, and it is the number Capers Jones argues separates top production groups from average ones.
- Separate avoidable rework from requirements change. Not all rework is failure. Requirements that genuinely emerged late are a cost of doing business. Rework caused by a defect that an existing technique would have caught is a tooling gap. Mixing the two produces an unusable number and an unwinnable argument.
- Price the evidence, not only the code. In a certified programme, add the hours spent regenerating coverage reports, rebuilding traceability and reopening the assessor dialogue. This is the cost layer the generic literature omits, and in our experience on Indian safety programmes it is the one that changes the decision.
Once those five things are in place, the business case writes itself from your own defect tracker, and it will be far more persuasive inside your organisation than any chart we could supply.
Questions engineers ask us about verification economics
Is it true that a bug costs 100 times more to fix in production?
Sometimes, and it depends heavily on what you are building. Boehm and Basili stated the 100x figure in IEEE Computer in January 2001 but deliberately qualified it with the word “often”, and noted in the same article that the escalation factor for small, non-critical systems is “more like 5:1 than 100:1”. The widely circulated 1 to 100 chart attributed to the “IBM Systems Sciences Institute” should not be used at all: the study behind it has never been located, and the trail ends at undated corporate course notes. For large, critical systems the escalation is genuinely steep, which is Boehm and Basili’s own qualification, and the NIST 02-3 table shows how wide the published range is, but quote the range and its source rather than a single round number.
What is the most defensible number to put in a business case?
The CISQ figure that almost fifty cents of every dollar over a large system’s 25 year life goes to finding and fixing defects, because it does not depend on a phase multiplier. Pair it with your own measured defect removal efficiency per stage.
Do we need static analysis if we already have good unit test coverage?
Yes, on the published defect removal efficiency data. Capers Jones puts automated unit testing at an average of 40 percent DRE and static analysis at an average of 85 percent, and states that high DRE “cannot be achieved using testing alone”. They find different defect populations. Perforce QAC and TESSY are deployed together for exactly this reason.
Does MISRA compliance reduce defect cost, or is it a certification formality?
Both, and the order matters. A coding standard enforced by a qualified analyser removes a class of defect at the point of writing, which is the cheapest point there is. The certification evidence is a by-product of doing that consistently. Our MISRA and AUTOSAR page sets out how the standards actually treat coding guideline conformance.
Can this be justified on a programme that is already late?
That is the hardest case and we will not pretend otherwise. Introducing static analysis to a mature codebase produces a large initial finding set, and the honest approach is a baseline-and-ratchet deployment: establish the current state as a baseline, gate only new and changed code, and burn the baseline down against risk. This is a configuration decision, and getting it wrong is the most common reason a static analysis rollout stalls.
Verification economics engineering from GSAS across India
GSAS Micro Systems is an engineering partner to Indian embedded teams building software that has to be defended, not merely delivered. We supply and deploy the static analysis, unit test and on-target coverage toolchain described on this page, we configure it for the standard your programme is working to, and we help your team measure its own defect removal efficiency so that the next verification budget is argued from evidence rather than from a slide.
Our engineers work with automotive Tier 1 suppliers, industrial automation builders, aerospace and defence electronics houses and medical device teams from Bengaluru, Hyderabad, Chennai, Pune, Mumbai and Delhi NCR, and we are close enough to be in the room when the defect that matters is found. If you are scoping a verification toolchain, or trying to work out what your current pipeline is letting through, that conversation is worth having in month 2. Request a quote or book a demo.
Also appears in:
Need embedded development tools?
Talk to our application engineers for personalized tool recommendations.