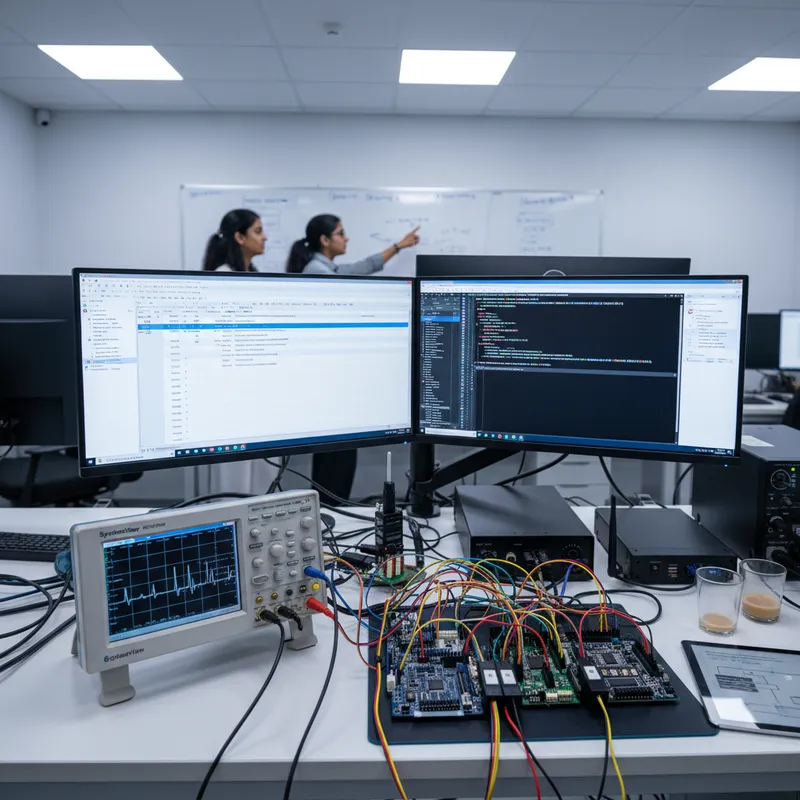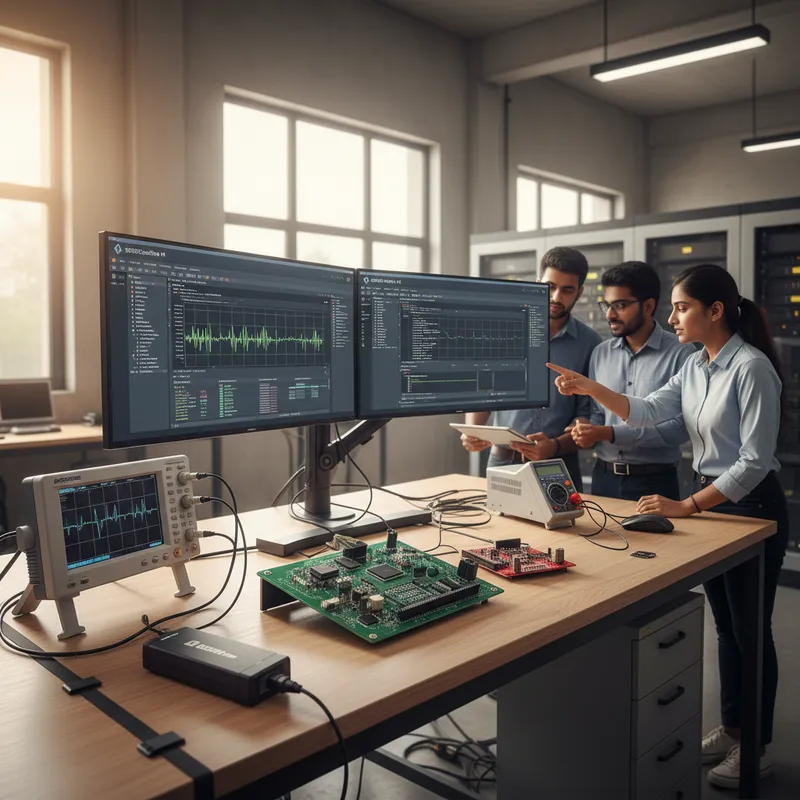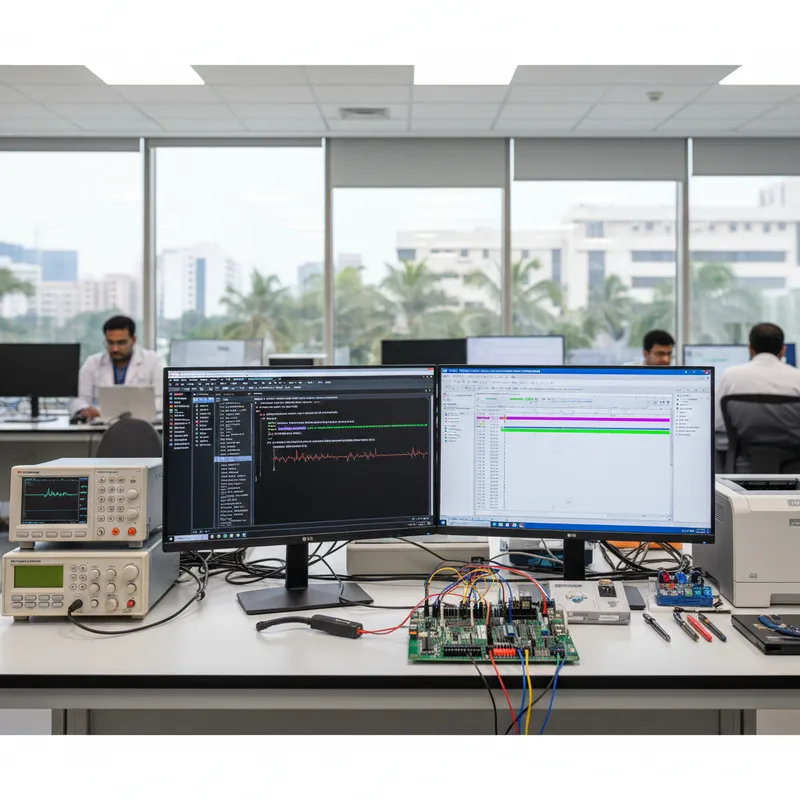
Every Indian medical device team preparing an IEC 62304 submission runs into the same conversation. The engineer who built the firmware is confident the RTOS is meeting its real-time constraints, the ECG samples at 1 kHz without dropping, the infusion pump’s drug-delivery control loop holds its period, the BLE stack in a patient monitor never blocks the acquisition task. But when the regulatory lead asks “where is the evidence?”, the answer is usually a shrug and the phrase “it seems to work on the bench”. That answer is not good enough for a CDSCO filing under ISO 13485, and it is definitely not good enough for an IEC 62304 Class B or Class C design history file that an auditor will read line by line.
The gap between “the team believes the firmware meets timing” and “here is the captured timeline proving it” is exactly what SEGGER SystemView closes. SystemView turns qualitative RTOS reassurance into quantitative, exportable, auditable evidence. This post explains the SystemView architecture, the instrumentation you need to add, three worked scenarios that map onto real Indian medical device projects, and how to include a SystemView capture in a design history file.
GSAS Micro Systems is an authorized engineering partner for SEGGER Microcontroller GmbH. SystemView ships with every SEGGER J-Link, and our offices in Bengaluru, Chennai, Hyderabad, Pune, Mumbai, and Delhi NCR provide local application engineering support to medical device teams working through IEC 62304 Class B and Class C submissions.
The evidence problem in an IEC 62304 filing
IEC 62304 is the international standard for medical device software lifecycles. It divides software into three safety classes, Class A (no injury possible), Class B (non-serious injury possible), Class C (serious injury or death possible). For anything above Class A, the standard requires you to demonstrate that your software architecture meets its stated requirements, including any real-time constraints. If your ECG monitor firmware is specified to sample at 1 kHz, you must be able to show that the 1 kHz deadline is met under the full range of system conditions, not just during an idle bench run, but during Bluetooth connection events, SD card writes, display refreshes, and watchdog checks.
The qualitative answer (“we observed it running for an hour and it looked fine”) does not satisfy IEC 62304. The quantitative answer is a captured timeline that shows every ISR, every task switch, every wait reason, and every deadline, with microsecond timestamps, over a representative period of operation. Without a tool, producing that evidence is almost impossible. With SystemView, it is a half-day job.
What SystemView actually measures
SystemView is a real-time recording and visualisation tool for embedded systems. It captures, on the target, the events that matter for RTOS behaviour analysis:
- ISR entry and exit (which ISR, when it started, when it finished)
- Task switches (which task became active, which task was suspended)
- Task wait reasons (waiting on a mutex, waiting on a semaphore, waiting on a message queue, waiting on a tick delay)
- User-defined event markers (your own “control loop iteration started” / “ADC conversion complete” / “drug dose delivered” markers)
- System state (current free heap, current interrupt nesting level, current tick)
Every event is timestamped with microsecond resolution using the target’s cycle counter. The capture is non-destructive, non-blocking, and has almost zero impact on target timing because the event records are pushed through a ring buffer that the host drains in the background.
How the data gets out: RTT (Real-Time Transfer)
SystemView does not need a spare UART or a dedicated trace pin. It uses SEGGER’s RTT (Real-Time Transfer) channel, which runs over the existing SWD debug interface via a J-Link probe. RTT is non-intrusive, the host reads a ring buffer in target RAM while the target continues executing, with no interrupts, no blocking, and no special hardware beyond the J-Link already on your bench. For a medical device where adding a pin to a pin-constrained package is not an option, this property alone is decisive.
The practical consequence: if your medical device target already has a J-Link PLUS or J-Link PRO on it for debugging, you already have a SystemView capture path. There is nothing to add to the board. Instrumenting the firmware is all that remains.
Instrumentation: adding the SystemView hooks
SystemView integration with common RTOSes is well-trodden. The integration pattern is roughly:
- Add the SystemView source files to your project (SEGGER provides them on their product page).
- Configure SystemView at startup by calling
SEGGER_SYSVIEW_Conf()before the RTOS kernel starts. - In each ISR, bracket the handler with
SEGGER_SYSVIEW_RecordEnterISR()at entry andSEGGER_SYSVIEW_RecordExitISR()at exit. For RTOS-managed ISRs that end with a context switch, use theRecordExitISRToSchedulervariant. - For RTOS task hooks, SEGGER provides drop-in hook files for embOS, FreeRTOS, and ThreadX that wire up task switch, task create, and task wait events automatically, you do not have to instrument each task by hand.
- Optionally, add application-level event markers at key points in your code (
SEGGER_SYSVIEW_RecordVoid()and friends) so the timeline shows domain-specific events alongside the RTOS events.
For an Indian medical device team instrumenting their firmware for the first time, expect a half to one day of engineering to stand up the first clean SystemView capture, and another half day to add the domain-specific event markers that make the timeline intelligible to a regulatory reviewer.
Reading the timeline: what the captures actually show
Once you have a capture, SystemView presents three views that matter for IEC 62304 evidence.
Timeline view shows tasks and ISRs as horizontal bars on a microsecond time axis. You can zoom from milliseconds down to individual cycles. A deadline miss shows up as a task that did not start soon enough relative to its activation event, you can see it with your eye, and SystemView reports it numerically.
CPU load view shows percentage utilisation per task and per ISR over the captured period. This is the chart you put in a design history file to prove that your control loop has the headroom it claims.
Context switch view lists every task switch with its reason (preempted, yielded, blocked on mutex, etc.). For tracing priority inversion bugs, a lower-priority task holding a resource a higher-priority task needs, this is the fastest path to a root cause.
Three patterns the medical device audit lens cares about most:
- A high-priority task that occasionally misses its deadline, visible as a gap in the timeline where it should have run.
- An ISR that monopolises the CPU, visible as an unusually wide ISR bar starving everything else.
- Priority inversion, a low-priority task blocking a high-priority task, visible as the high task parked in a wait state while the low task runs.
Worked scenario 1: an ECG monitor on nRF5340, 1 kHz sampling and BLE
An Indian ECG monitor team building on a Nordic nRF5340 (dual-core Cortex-M33) needs to prove that the ECG sampling task meets its 1 kHz deadline even while a Bluetooth Low Energy connection event is active. The worry is that the BLE stack on the network core, or the BLE host tasks on the application core, could preempt the sampling task long enough to miss a sample.
The SystemView capture plan: instrument the ECG sampling task, the ADC-ready ISR, and the BLE event callbacks. Add an event marker at the start of every sampling iteration. Run a five-minute capture with a BLE connection actively exchanging data. Inspect the timeline. The evidence in the design history file is a screenshot of the timeline plus a CPU-load table showing the ECG sampling task’s worst-case iteration interval over the full capture window. An auditor can read this and see immediately that the 1 kHz deadline is met.
Worked scenario 2: an infusion pump control loop on STM32U5
Scenarios in this article are illustrative, common patterns Indian engineering teams encounter, not specific named customers.
A typical Bengaluru-area-based infusion pump team building on an STM32U5 (Cortex-M33, TrustZone, ultra-low-power) needs to show the drug-delivery control loop’s jitter distribution. The control loop runs at a fixed period, and for IEC 62304 Class C evidence the team needs to demonstrate the distribution of actual period lengths over a long capture.
The SystemView capture plan: instrument the control loop task and add an event marker at the top of every iteration. Capture for a full duty cycle of the device including the user interface task, the communication task, and the watchdog. Export the event marker timestamps, compute the period histogram, and include the histogram in the design history file. The histogram is the evidence, it shows that the control loop period is tightly clustered around the target period with no long tail, which is exactly what a reviewer wants to see.
Worked scenario 3: a flight-controller-adjacent attitude loop
A team building a flight-controller-class embedded product on a Cortex-M7 (not a medical device, but the instrumentation pattern is identical) needs to capture attitude-loop timing. The attitude loop consumes IMU data at a high rate and must never miss a cycle. SystemView captures the IMU ISR, the attitude loop task, and the motor output task, and the timeline shows exactly how the three interact during a disturbance event. The team uses the same capture as a flight-safety-case evidence artefact, and the workflow is the same one an Indian medical device team uses for IEC 62304.
embOS, FreeRTOS, and ThreadX: all three work, but embOS fits tightest
SystemView supports SEGGER’s own embOS, the open-source FreeRTOS kernel, and Microsoft’s ThreadX (formerly Express Logic). All three integrations are production-quality. The tightest integration is with embOS, because SEGGER develops SystemView and embOS together, every embOS release ships with matching SystemView hooks, and the embOS team can guarantee accuracy of task-state reporting at a level that is harder to reach when integrating across a third-party kernel.
If your medical device project has not yet chosen an RTOS, and you are targeting IEC 62304 Class B or Class C, embOS is worth a serious look, SEGGER also offers embOS-Safe, a pre-certified variant of embOS for safety-critical applications, which accelerates the certification paperwork significantly.
Exporting the timeline as design history evidence
SystemView lets you save a full capture to a file on the host. That file is the raw evidence artefact. For a design history file, the usual practice is to include:
- The raw SystemView capture file (as an appendix)
- One or more screenshot exports of the timeline view highlighting the deadline-critical task
- A CPU-load table for the captured window
- A summary paragraph describing what the capture represents (device state, operator actions during capture, input conditions, duration)
- A statement linking the capture to the specific IEC 62304 software requirement the evidence supports
An auditor reading this package can independently open the SystemView file and inspect the timeline, which is exactly the kind of reproducible, independently-verifiable evidence the standard expects.
Ordering J-Link PRO for high-speed SystemView capture through GSAS
For SystemView captures, the J-Link model you use matters. SystemView’s RTT channel runs faster on J-Link PRO and J-Link ULTRA than on entry-level models, and for long captures (minutes of timeline with dense events) the extra throughput reduces buffer overruns and ensures every event is delivered to the host. For a medical device team setting up a regulatory-grade capture workflow, J-Link PRO is the sensible default, it also adds Ethernet and isolated JTAG/SWD, which matters when the target is on a bench rig with separate power domains.
GSAS supplies J-Link PRO, J-Link PLUS, and J-Link ULTRA in India through our engineering-partner relationship with SEGGER, serving Bengaluru, Chennai, Hyderabad, Pune, Mumbai, and Delhi NCR. We provide INR invoicing, GST documentation, and local application engineering support for medical device teams working through IEC 62304 submissions.
Further reading
- SEGGER SystemView product page: segger.com/products/development-tools/systemview
- SEGGER SystemView downloads (User Manual): segger.com/downloads/systemview
- SEGGER embOS product page: segger.com/products/rtos/embos
- SEGGER RTT (Real-Time Transfer) overview: segger.com/products/debug-probes/j-link/technology/about-real-time-transfer
- GSAS, SEGGER SystemView in India: /products/segger/segger-systemview
- GSAS, SEGGER embOS in India: /products/segger/segger-embos
- GSAS, SEGGER Ozone debugger in India: /products/segger/segger-ozone
- GSAS, SEGGER J-Link PRO in India: /products/segger/j-link-pro
- GSAS, SEGGER embOS for ISO 26262 automotive: /blog/segger-embos-safe-iso-26262-indian-automotive-tier1
- GSAS, SEGGER partner page: /partners/segger
Also appears in:
Interested in SEGGER tools?
Talk to our application engineers for personalized tool recommendations.
More from SEGGER
View all →
Meet the GSAS Team at electronica India 2026, Stall H3.I45
15 Sept · 3 min
J-Link Is Now Validated by ST for StellarStudio
13 Sept · 2 min

An AI Agent That Drives the Debugger: SEGGER and Embedder Connect J-Link to the Loop
13 Sept · 6 min
SEGGER J-Link and J-Trace Now Support Andes Trace: Why This Matters for RISC-V
21 Jul · 6 min

Emulating Processor Power for Thermal Testing: Why Constant Power
7 Oct · 7 min

CRPS and Rack Power Supply Testing: The Six Tests That Matter
7 Oct · 7 min