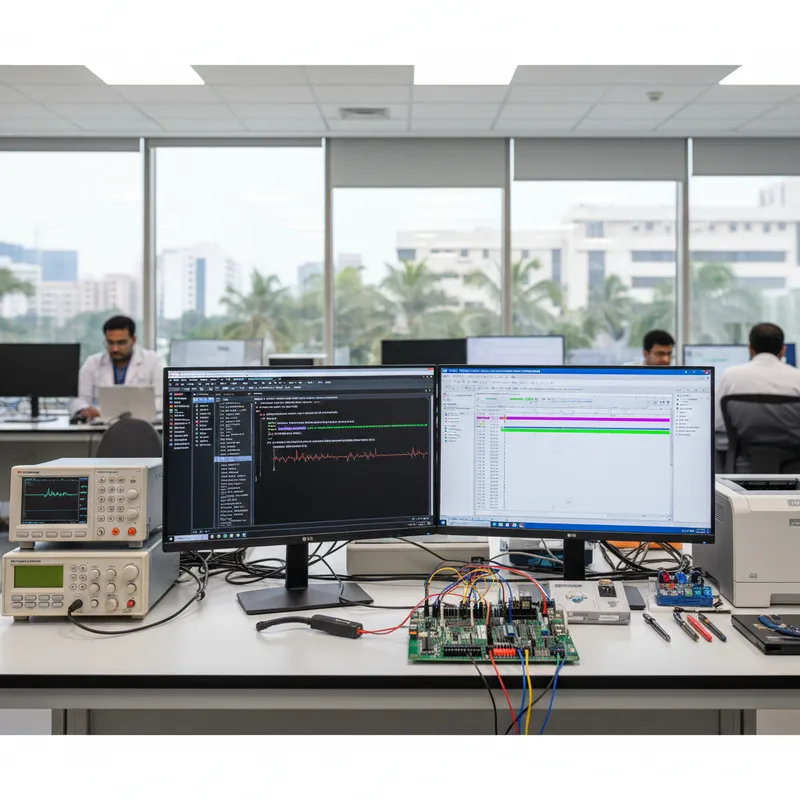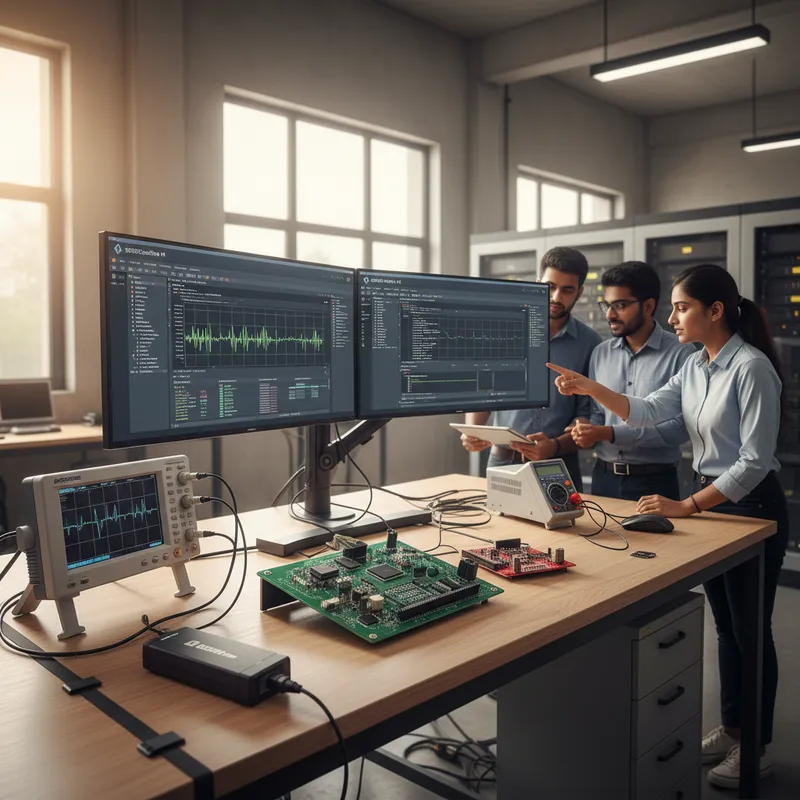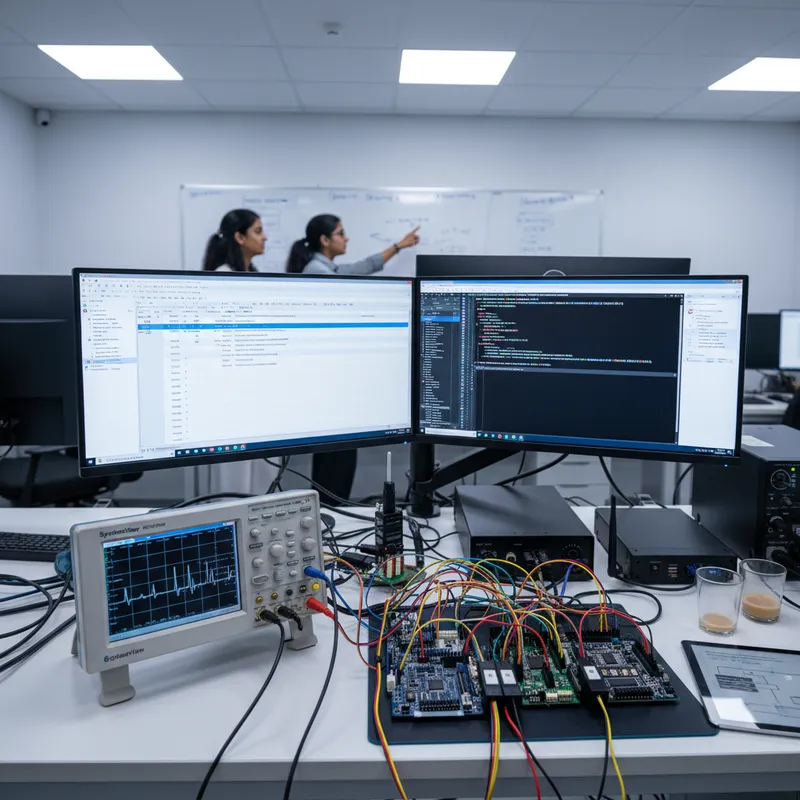
Wireless IoT product debugging is where traditional logging gives up. A Cortex-M gateway running FreeRTOS with FreeRTOS-Plus-TCP, a Wi-Fi or BLE or Thread driver task, an MQTT client, and application logic has four or five concurrent activities all contending for CPU and for locks, and when something goes wrong, a dropped packet, a missed sensor read, a cloud-uplink stall, a mysterious latency spike once a minute, pinpointing the root cause from printf output alone is genuinely hard. You need a timeline. That timeline is what SEGGER SystemView gives you.
GSAS Micro Systems is an authorized Indian engineering partner for SEGGER Microcontroller GmbH, and this guide covers how Indian wireless IoT teams are using SystemView with FreeRTOS-Plus-TCP, and with vendor SDKs like Nordic Connect SDK, ESP-IDF, and Renesas FSP, to diagnose the timing problems that matter for production IoT products.
Why SystemView, specifically for FreeRTOS networking
SystemView is a recording and visualization tool that instruments the FreeRTOS scheduler and renders events on a microsecond-aligned timeline. It captures the things that printf cannot show you well:
- Task switches: which task ran when, for how long, and what caused the switch
- Interrupt entry and exit: every ISR is timestamped to microseconds, including nested interrupts
- Mutex, semaphore, and queue operations: acquisition, release, blocking, and the queue depth at each event
- User-defined event markers: your application code can emit named events to annotate the timeline with domain-specific milestones (“sensor sample start”, “MQTT publish begin”, “modem wakeup”)
- Stack usage tracking: works with FreeRTOS’s task stack monitoring to catch leaks and near-overflow conditions
For a wireless IoT product, the value is that you can see the entire system behaviour across 10 seconds or 10 minutes of runtime and spot the pattern that causes the intermittent failure, rather than adding more printfs and hoping.
What FreeRTOS-Plus-TCP looks like in SystemView
FreeRTOS-Plus-TCP runs its network-stack work inside a dedicated task, typically prvIPTask. On the SystemView timeline, this task shows up clearly, you can see when it runs, for how long, and what it is doing. Specifically:
- Packet reception:
prvIPTaskwakes up when the Ethernet/Wi-Fi driver hands it a received frame, processes ARP/IP/TCP/UDP layers, and delivers to the socket owner - Socket-API blocking events: when an application task calls
FreeRTOS_recv()and blocks waiting for data, the block shows up as a task-block-on-queue event on the timeline - DHCP, ARP, DNS, TCP retransmit timing: each of these network-level events is visible as a discrete activity on the network task’s lane
- TCP send stalls: when a send appears to hang, SystemView tells you which task is blocked, on what, and what else was running during the stall window
The insight that matters: in a healthy system the network task runs briefly and frequently. In a sick system it runs for long bursts or misses its deadline behind another task holding a lock. SystemView makes this visible at a glance rather than requiring you to reason about it abstractly.
ELF integration in SystemView V4
SystemView V4 introduced automatic ELF integration, the tool reads your firmware’s ELF file and pulls resource names (task names, queue names, semaphore names) directly. This is covered in depth in our SystemView V4 ELF integration guide, and for FreeRTOS-Plus-TCP it specifically means that you do not need to manually register the prvIPTask name, the MQTT client task name, or your application task names with SystemView at runtime. The names appear on the timeline automatically, which makes the difference between a timeline that reads like “Task A / Task B / Task C” and one that reads like “prvIPTask / mqttClient / sensorTask / wifiDriver”.
Indian wireless IoT use cases
Scenarios in this article are illustrative, common patterns Indian engineering teams encounter, not specific named customers.
Illustrative scenario, Wi-Fi IoT. A typical Bengaluru-area Wi-Fi IoT product team was debugging a subtle production bug: their MQTT publish latency was normally in the 40–60 ms range, but once a minute it spiked to around 800 ms, and some messages were dropped when the spike coincided with a peak sensor sampling load. Traditional logging suggested a Wi-Fi driver issue but could not confirm it. A SystemView capture over two minutes showed the real cause: the ARP cache refresh inside FreeRTOS-Plus-TCP was colliding with the sensor sampling loop. The sensor loop held a SPI mutex that the network driver also needed, and the ARP refresh interval happened to align with the sensor burst. The fix was a small priority inversion guard plus a SPI mutex timeout, and SystemView made the collision pattern obvious within a single screen of the timeline.
Illustrative scenario, cellular IoT. A typical Pune-area cellular IoT (LTE-M) team was diagnosing intermittent socket connect failures in the field. A SystemView capture revealed that prvIPTask was periodically blocked behind a stale mutex held by the cellular modem driver, the modem’s AT-command response parser had a timeout handler that did not release the mutex on the failure path. Printf logging had shown “socket connect failed” but not the reason. SystemView showed the mutex holder, the blocked task, and the timing relationship to the modem’s timeout event. The fix was a one-line mutex release in the driver’s error path.
Illustrative scenario, industrial gateway. A typical Chennai-area industrial gateway team was sizing the FreeRTOS task stacks for a 24/7 deployment. SystemView’s stack-usage tracking caught a slow leak in one of the application tasks: stack usage was growing by ~4 bytes per hour under normal load, and the team projected a crash at approximately 14 days of continuous operation. Without SystemView, the first evidence would have been a failed customer deployment. With SystemView, they caught it during a four-day soak test and fixed the leak before first shipment.
Illustrative scenario, consumer IoT. A typical Hyderabad-area consumer IoT team was validating BLE and Wi-Fi coexistence on an nRF5340, the nRF5340 has two cores, one running the network stack and one running the application, and the contention patterns between BLE scan windows and Wi-Fi association are exactly the kind of interaction that only shows up at runtime. Running SystemView captures on both cores (the network core and the application core) let them see the contention pattern and adjust BLE scan window timing to avoid the worst overlaps. The J-Link and Nordic nRF52 development guide covers the multi-core debug setup that makes this workflow possible.
Hardware: which J-Link for SystemView capture?
SystemView captures go over SEGGER Real-Time Transfer (RTT), and RTT bandwidth is determined by the J-Link model and the USB connection to the host. For a casual development capture, any J-Link BASE or J-Link PLUS is sufficient. For sustained high-throughput logging on a busy wireless IoT product, where the scheduler event rate can be thousands of events per second and the recording window is minutes or hours, the J-Link ULTRA is the typical choice because of its higher RTT throughput on USB 2.0 Hi-Speed. For CI/CD and long-running soak tests where the J-Link sits on a rack far from the developer workstation, J-Link PRO with Ethernet gives you network-attached access and isolated JTAG. Teams also running power profiling in the same debug session pair SystemView with Ozone on the same J-Link hardware.
Integration recommendation
An Indian wireless IoT team standardizing on SystemView should wire up the instrumentation early, ideally in the first week of bringup, not when a production bug forces the issue. The right setup is a J-Link ULTRA on developer benches, SystemView V4 with automatic ELF name resolution, FreeRTOS with the SystemView configuration enabled, and an agreed-on naming convention for user-defined events so that the timeline annotations are consistent across developers. Pair SystemView captures with emNet and emSSL for secure cloud uplinks when your product talks to AWS IoT Core or Azure IoT Hub, and keep a small set of canonical SystemView trace files in the repo so new team members know what “healthy system behaviour” looks like before they start debugging broken ones.
Further reading
- SEGGER SystemView at segger.com
- SEGGER SystemView V4 release announcement
- SEGGER SystemView product page
- SystemView V4 ELF integration for FreeRTOS debugging in India
- SystemView as IEC 62304 evidence for medical device development
- emNet and emSSL with AWS IoT and Azure from India
- J-Link and Nordic nRF52 BLE development in India
- J-Link and Espressif ESP32 India debug workflow
- Multi-core debug with J-Link on i.MX RT1170, nRF5340, and RP2350
- SEGGER partner page at GSAS
Work with GSAS
GSAS Micro Systems is an authorized Indian engineering partner for SEGGER Microcontroller GmbH. We help wireless IoT teams across Bengaluru, Hyderabad, Chennai, Pune, Mumbai, and Delhi NCR set up SystemView for FreeRTOS and FreeRTOS-Plus-TCP debugging, evaluate the right J-Link model for their sustained RTT throughput needs, and instrument their firmware with the user-defined events that turn SystemView from a pretty visualisation into an operational diagnostic tool. Talk to our engineering team if you are fighting an intermittent wireless IoT timing bug or sizing a new product’s task and stack budget.
Also appears in:
Interested in SEGGER tools?
Talk to our application engineers for personalized tool recommendations.
More from SEGGER
View all →
Meet the GSAS Team at electronica India 2026, Stall H3.I45
15 Sept · 3 min
J-Link Is Now Validated by ST for StellarStudio
13 Sept · 2 min

An AI Agent That Drives the Debugger: SEGGER and Embedder Connect J-Link to the Loop
13 Sept · 6 min
SEGGER J-Link and J-Trace Now Support Andes Trace: Why This Matters for RISC-V
21 Jul · 6 min

Emulating Processor Power for Thermal Testing: Why Constant Power
7 Oct · 7 min

CRPS and Rack Power Supply Testing: The Six Tests That Matter
7 Oct · 7 min