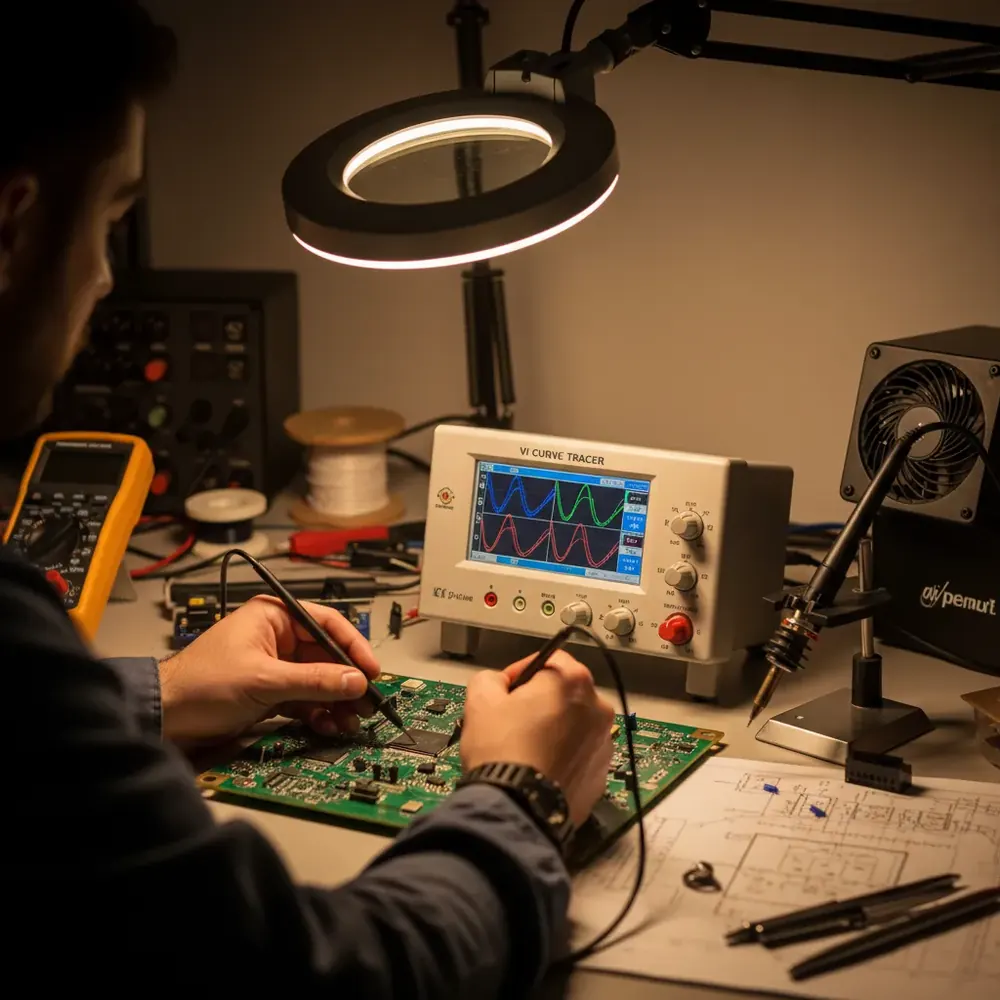
When a printed circuit board fails in the field, the traditional approach is to power it up, probe test points, and hope the fault reveals itself before something else breaks. VI curve tracing inverts that logic. By applying a controlled AC stimulus to unpowered components and observing the resulting voltage-current relationship, technicians can identify faulty parts without ever energizing the board.
For India’s expanding electronics manufacturing and repair ecosystem, from defence avionics workshops in Bengaluru to consumer electronics service centres in Noida, this technique is becoming indispensable.
What Is VI Curve Tracing?
A VI curve tracer applies a low-voltage, current-limited AC signal across a component’s terminals and plots the resulting voltage (X-axis) against current (Y-axis). The shape of this curve, its signature, is determined by the electrical characteristics of the component under test.
A resistor produces a straight line whose slope corresponds to its resistance. A capacitor traces an ellipse. A diode draws its characteristic knee curve. A short circuit collapses into a vertical line, while an open circuit flatlines horizontally. Semiconductor junctions, zener breakdowns, and leaky capacitors each produce distinct, recognizable patterns.
These signatures are generated without powering the board. The test signal is typically under 10 V peak and current-limited to milliamps, meaning you can safely probe any node, including nodes connected to sensitive ICs, FPGAs, or microcontrollers, without risk of secondary damage.
The FADOS Platform: 9F1 and 7F1
ProT Ar-Ge’s FADOS (FAult Detector OScilloscope) platform brings VI curve tracing into a modern, software-driven workflow.
FADOS 9F1 is the flagship, combining a dual-channel VI curve tracer with a built-in oscilloscope, function generator, frequency counter, and multimeter, five instruments in one bench unit. The dual channels display a known-good reference signature alongside the device under test simultaneously. The 9F1 supports test frequencies from 50 Hz to 5 MHz, which matters because different frequencies excite different failure modes. A capacitor that looks healthy at 50 Hz might show dielectric degradation at 500 kHz. FADOS 7F1 focuses purely on VI curve analysis. It retains dual-channel comparison, multiple test frequencies, and the same software interface, but omits the oscilloscope and function generator. For facilities with standalone scopes, the 7F1 delivers core fault-finding capability at a lower investment.
Both models connect to a PC running FADOS software, which provides signature storage, comparison overlays, pass/fail thresholds, and reporting.
Comparing Good vs. Faulty Signatures
The practical power of VI curve tracing lies in comparison. Three strategies cover most scenarios.
Good board vs. bad board. Probe each component on a known-good board, storing signatures. Then probe the same points on the faulty board and overlay the curves. Any deviation, a changed slope, a shifted knee, a collapsed ellipse, points to a fault. FADOS stores signatures in a database, so you do not need the good board physically present every time. Component-level comparison. When no known-good reference exists, compare identical components against each other. If a board has four identical MOSFET driver stages, probe all four. Three matching signatures and one outlier immediately identifies the faulty stage. Datasheet correlation. For discrete components, compare the measured VI signature against expected datasheet behaviour. A zener diode should break down at its rated voltage. A TVS diode should show its clamping characteristic.
Practical PCB Repair Workflow
A structured VI curve tracing workflow proceeds as follows.
Step 1, Visual Inspection. Examine the board for obvious damage: burnt components, cracked solder joints, bulging capacitors, discoloured substrate. Step 2, Build the Reference Library. Probe every major component on a known-good board, storing signatures in the FADOS database. Label each point clearly, U3 pin 1, C47 positive, Q12 drain. This library becomes a reusable asset for all future repairs of that board type. Step 3, Systematic Probing. On the faulty board, work through the same points. FADOS overlays each measurement against the stored reference. Step 4, Narrow the Fault. A changed signature at a net junction could indicate a fault in any connected component. Lift one leg of suspect components to isolate them, then re-probe. When the isolated component deviates from reference, you have found the faulty part. Step 5, Replace and Verify. After replacement, re-probe to confirm the signature matches reference. Then power up for functional testing.
This workflow works on boards where schematics are unavailable, a significant advantage in the Indian defence and aerospace sector, where legacy equipment may lack documentation.
Multi-Frequency Testing
Single-frequency VI curve tracing can miss certain failure modes. A ceramic capacitor with partial dielectric breakdown might appear normal at 50 Hz but show a distorted signature at higher frequencies. FADOS addresses this with selectable test frequencies. A standard probing sequence might include 50 Hz (baseline), 1 kHz (mid-range), and 100 kHz (high-frequency stress). Components that pass at all three frequencies are almost certainly healthy.
Where VI Curve Tracing Fits in India
India’s electronics manufacturing sector continues its rapid expansion, bringing a proportional increase in boards needing rework, repair, or failure analysis. For EMS providers handling automotive ECUs, industrial controllers, and telecom infrastructure boards, VI curve tracing offers a systematic alternative to ad hoc troubleshooting. The technique is especially valuable for:
- No-fault-found (NFF) boards: VI signatures can reveal marginal components that functional tests miss.
- Legacy equipment support: defence and railway systems with 20-year lifecycles and no available schematics.
- Incoming quality inspection: verifying assemblies from contract manufacturers before acceptance.
For high-volume environments, FADOS MUX expansion units automate probing across up to 100 channels, transforming VI curve tracing from a bench-level diagnostic into a production-line screening tool.
Getting Started with FADOS in India
GSAS Micro Systems is an authorized Indian partner for ProT Ar-Ge’s complete FADOS product line, including the 9F1, 7F1, and MUX expansion systems. Our applications engineering team provides instrument demonstrations, fixture design consultation, and training programs tailored to your board repair workflow.
Contact GSAS to discuss which FADOS configuration matches your requirements. Visit gsasindia.com or reach out to our technical team for a consultation.
Also appears in:
Interested in ProT Ar-Ge tools?
Talk to our application engineers for personalized tool recommendations.
More from ProT Ar-Ge
View all →
FADOS Test Reports and GSAS Agent: Turning Board Test Results into an Auditable Record
4 Aug · 8 min

FADOS Circuit Board Tester: Complete Guide for Indian Repair Teams
16 Apr · 13 min
FADOS XI Frequency Scanning and VI Curve Tracing for PCB Diagnostics
16 Apr · 11 min
FADOS XI Non-Contact Short Circuit Detection: Find PCB Shorts in Seconds
16 Apr · 9 min

Emulating Processor Power for Thermal Testing: Why Constant Power
7 Oct · 7 min

CRPS and Rack Power Supply Testing: The Six Tests That Matter
7 Oct · 7 min