Two Approaches to Board-Level Testing
In-Circuit Testing (ICT) and VI curve tracing are both used to detect faults on populated PCBs, but they work on fundamentally different principles and serve different operational contexts. Understanding where each approach excels, and where it falls short, is essential for choosing the right test strategy.
In-Circuit Testing (ICT): The Production Standard
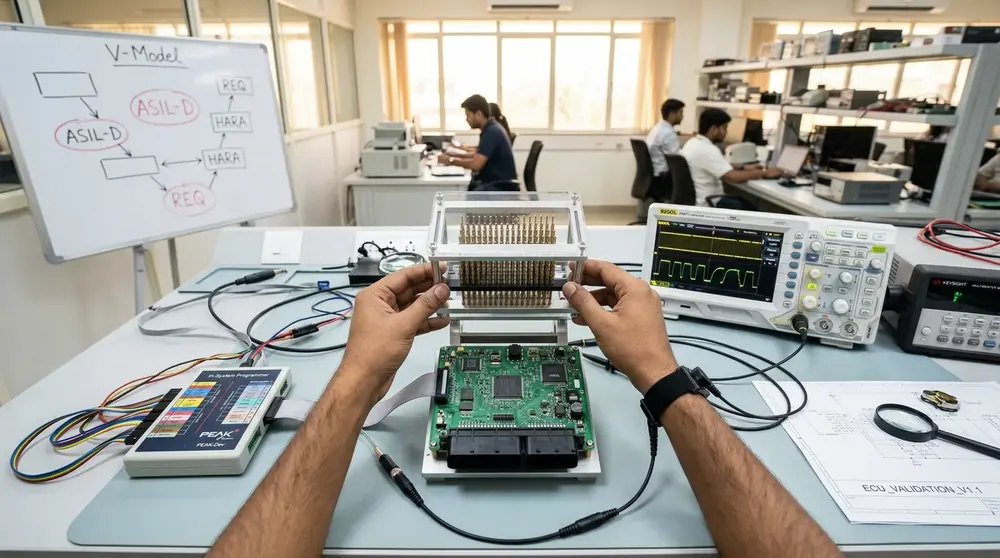
ICT systems use a bed-of-nails fixture to simultaneously contact hundreds or thousands of test points on a board. The system then measures individual component values (resistance, capacitance, inductance), tests semiconductor junctions, verifies connectivity, and checks for shorts and opens.
ICT Strengths
- Component-level measurement: ICT measures actual component values, not just signatures. A 10 kohm resistor is verified as 10 kohm within tolerance.
- High throughput: With all probes making contact simultaneously, a complete test can execute in seconds.
- Standardized pass/fail criteria: Component value tolerance bands are defined by the design, making pass/fail determination objective and repeatable.
- Boundary scan integration: Modern ICT systems integrate JTAG boundary scan for testing interconnects to BGA and fine-pitch devices.
ICT Limitations
- Fixture cost: A bed-of-nails fixture for a modern board costs Rs 5–20 lakh, depending on complexity. This cost is justified only for high-volume production runs.
- Fixture lead time: Custom fixture fabrication takes 4–8 weeks.
- Test point access: The board must be designed with ICT test points, accessible pads connected to each node. Many modern designs, especially HDI boards, lack adequate test point coverage.
- Equipment cost: ICT systems (Keysight, Teradyne, SPEA) cost Rs 50 lakh to several crore, placing them beyond the reach of small and medium repair operations.
- Design change rigidity: When the board design changes, the fixture must be modified or rebuilt.
VI Curve Tracing (FADOS): The Flexible Alternative
The FADOS 9F1 and FADOS 7F1 VI curve tracers apply a controlled AC stimulus to test points and measure the resulting voltage-current relationship. Instead of measuring individual component values, VI tracing captures the aggregate impedance signature of each circuit node and compares it against a known-good reference.
VI Tracing Strengths
- No fixture required for manual testing: A technician with probes can test any board immediately, no fixture design, no lead time.
- Equipment cost: A FADOS 9F1 with software costs a fraction of an ICT system, making it accessible to repair shops, depot maintenance facilities, and small EMS operations.
- Design-agnostic: VI tracing works on any board regardless of whether it was designed with test points. Probe any accessible pad or via.
- Repair diagnostics: VI tracing excels at fault localization, identifying which specific component or area has failed, whereas ICT is primarily designed for go/no-go production screening.
- Legacy board support: VI tracing can test boards for which no schematics, netlists, or design data exist. A golden reference board is sufficient.
- Scalable automation: The FADOS MUX adds 100-Channel automated testing when throughput demands increase, at a fraction of ICT fixture cost.
VI Tracing Limitations
- Relative measurement: VI tracing compares signatures, not absolute values. Without a reference, you are interpreting signatures based on experience.
- Lower throughput than ICT: Even with the MUX, FADOS scans 100 channels sequentially, not simultaneously. Per-board test time is measured in tens of seconds, not single seconds.
- Sensitivity to board state: Discharged capacitors, residual charge, and board temperature can affect signatures. Consistent test conditions are important.
Head-to-Head Comparison
| Criterion | ICT | FADOS VI Tracing |
|---|---|---|
| Equipment cost | Rs 50 lakh–5 crore | Rs 3–8 lakh (9F1 + MUX) |
| Fixture cost per board | Rs 5–20 lakh | Rs 20,000–1 lakh (MUX fixture) |
| Fixture lead time | 4–8 weeks | 1–2 weeks (simple pogo fixture) |
| Test coverage | Component-level values + connectivity | Node-level impedance comparison |
| Throughput | 5–15 seconds per board | 30–90 seconds per board (MUX) |
| Schematic required? | Yes (for fixture design) | No (golden board sufficient) |
| Repair diagnostics | Limited (identifies failed node) | Strong (localizes specific fault) |
| Legacy board support | Requires design data | Works with reference board only |
| Best for | High-volume production (>10,000/year) | Repair, low-mid volume, mixed boards |
When to Use Each Approach
Choose ICT When:
- Production volumes exceed 10,000 boards per year of the same design
- Board design includes adequate ICT test point access
- Component-level measurement is required by quality standards (automotive, aerospace)
- Test time per board must be under 15 seconds
Choose FADOS VI Tracing When:
- You repair or refurbish boards from multiple designs
- Production volumes are low to medium (under 10,000/year per design)
- Board designs lack dedicated ICT test points
- Budget for test equipment is under Rs 10 lakh
- You need to support legacy boards without design documentation
- Fault localization and root cause analysis are primary goals
Use Both When:
Large EMS operations often deploy ICT for production screening and FADOS for failure analysis. Boards that fail ICT go to a diagnostic bench where a FADOS 9F1 localizes the fault for rework. The two approaches are complementary, not competing.
Why Buy FADOS from GSAS
GSAS Micro Systems is an authorized ProT Ar-Ge partner and ODM assembler. We can help you evaluate whether VI curve tracing, ICT, or a combined approach best fits your production and repair requirements.
Contact our engineers at offices in Bengaluru, Hyderabad, Chennai, Pune, Mumbai, and Delhi NCR for a consultation and live demonstration.
- INR invoicing with GST-compliant documentation
- Demo units for hands-on evaluation
- Application engineering for test strategy planning
Also appears in:
Interested in ProT Ar-Ge tools?
Talk to our application engineers for personalized tool recommendations.
More from ProT Ar-Ge
View all →
FADOS Test Reports and GSAS Agent: Turning Board Test Results into an Auditable Record
4 Aug · 8 min
FADOS Circuit Board Tester: Complete Guide for Indian Repair Teams
16 Apr · 13 min
FADOS XI Frequency Scanning and VI Curve Tracing for PCB Diagnostics
16 Apr · 11 min
FADOS XI Non-Contact Short Circuit Detection: Find PCB Shorts in Seconds
16 Apr · 9 min

Emulating Processor Power for Thermal Testing: Why Constant Power
7 Oct · 7 min

CRPS and Rack Power Supply Testing: The Six Tests That Matter
7 Oct · 7 min