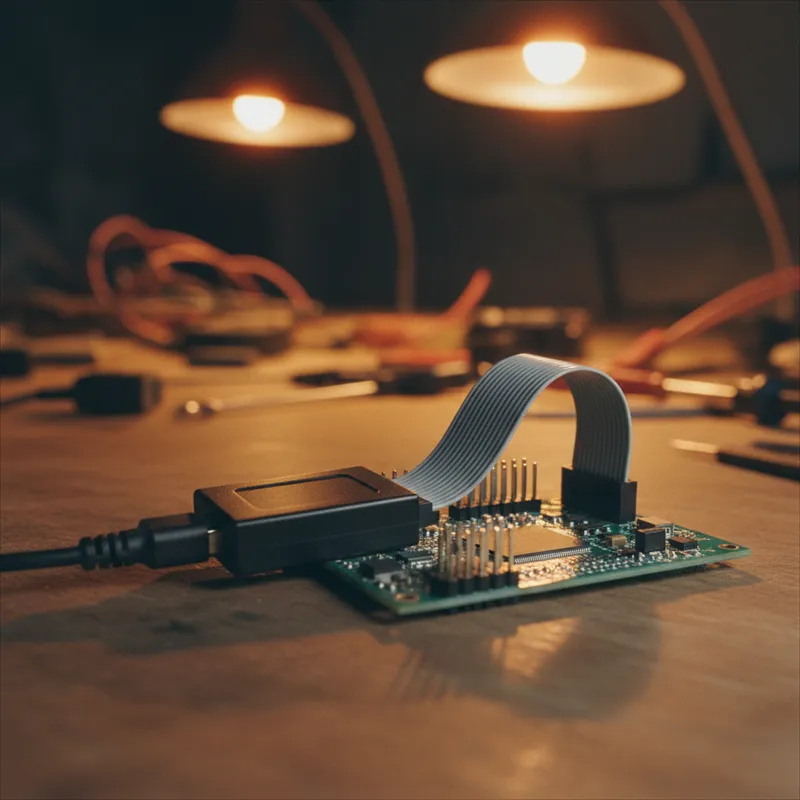
One Instrument, Two Domains
The GW Instek MDO-2000E is a mixed-domain oscilloscope (MDO) that combines a digital oscilloscope with a spectrum analyzer in a single instrument. Rather than using two separate instruments on the bench, an oscilloscope for time-domain signals and a spectrum analyzer for frequency-domain analysis, the MDO-2000E displays both simultaneously, correlated in time.
For engineers developing embedded systems with wireless connectivity (Wi-Fi, Bluetooth, Zigbee, LoRa, cellular), IoT devices, and RF-enabled products, this combined view solves a fundamental measurement problem: seeing what is happening in both domains at the same time.
Oscilloscope Specifications
The MDO-2000E’s oscilloscope section provides specifications suited to general-purpose embedded and mixed-signal debugging:
- Bandwidth: 100 MHz and 200 MHz models
- Channels: 2 analog + 1 dedicated RF input (some models), or 4 analog channels
- Sample rate: Up to 1 GS/s
- Memory depth: Up to 10 Mpoints per channel
- Triggering: Edge, pulse, video, pattern, and serial bus triggers
- Protocol decoding: I2C, SPI, UART, CAN, LIN (licence-based options)
Built-In Features
The MDO-2000E includes several capabilities that typically require separate licences on competing instruments:
- Waveform generator: Built-in arbitrary waveform generator (25 MHz), useful for stimulus-response testing without a separate function generator
- Logic analyzer: 16 digital channels (MSO models) for mixed-signal debugging
- Protocol trigger and decode: Available for common serial buses
- Power analysis: Automated power supply measurements (switching loss, harmonics, ripple)
Spectrum Analyzer Section
The spectrum analyzer input is a dedicated RF channel with its own front end, separate from the oscilloscope channels. This architectural choice matters, the RF input has appropriate impedance matching (50 ohm), sensitivity, and dynamic range for frequency-domain measurement.
- Frequency range: 0 Hz to 2.5 GHz
- Resolution bandwidth: Adjustable, suitable for narrowband signal analysis
- Display modes: Normal spectrum, spectrogram (frequency vs time waterfall), persistence
Correlated Time-Frequency Display
The MDO-2000E’s defining feature is time correlation between the oscilloscope and spectrum analyzer views. When the engineer triggers the oscilloscope on a digital event, say, a microcontroller toggling a GPIO pin, the spectrum analyzer display shows the RF spectrum at that exact moment.
This correlation reveals:
- RF emissions from digital switching: See which digital events cause spectral spurs
- Wireless module behaviour: Correlate firmware actions (visible on digital channels) with RF transmission (visible on spectrum)
- EMC debugging: Identify the time-domain source of spectral emissions
- Interference diagnosis: Capture the time-domain signature of intermittent RF interference
Application: IoT Device Development
IoT devices combine a microcontroller, sensors, and a wireless module (Wi-Fi, BLE, LoRa, NB-IoT) on a single PCB. During development, engineers need to:
- Debug firmware using oscilloscope channels to monitor SPI/I2C communication with sensors
- Verify RF performance using the spectrum analyzer to confirm the wireless module transmits at the correct frequency with expected power
- Identify interference between the digital and RF sections of the board
The MDO-2000E handles all three on a single instrument, reducing bench clutter and measurement setup time.
Practical Example: BLE Module Commissioning
- Oscilloscope channel 1: SPI clock between microcontroller and BLE module
- Oscilloscope channel 2: SPI MOSI data line
- Spectrum analyzer: 2.4 GHz band, monitoring BLE advertising packets
- Digital channels (MSO): GPIO pins indicating firmware state (advertising, connected, sleeping)
When the firmware commands the BLE module to start advertising, the engineer sees the SPI transaction, the GPIO state change, and the 2.4 GHz advertising signal appear, all time-correlated. If the BLE module fails to transmit, the time correlation immediately reveals whether the SPI command was sent correctly, whether the firmware reached the expected state, and whether any RF energy appeared at all.
Application: EMC Pre-Compliance
The MDO-2000E’s combined oscilloscope and spectrum analyzer capabilities support in-house EMC investigation:
- Use the spectrum analyzer to identify problematic emission frequencies
- Switch to the oscilloscope view and trigger on the digital signals that operate at or near those frequencies
- Identify the specific circuit activity causing the emission
- Modify the design and re-measure immediately
This iterative debug cycle, measure emission, identify source, modify, re-measure, is dramatically faster with a single-instrument MDO than with separate oscilloscope and spectrum analyzer setups.
Comparison with Separate Instruments
An engineer could achieve similar measurement capability with a standalone oscilloscope and a standalone spectrum analyzer. The MDO-2000E’s advantage is integration:
- Single instrument instead of two, lower total cost, less bench space
- Time correlation between domains, not possible with separate instruments unless they share an external trigger and careful synchronization
- Simplified setup: one set of probes, one interface, one learning curve
The trade-off: a dedicated spectrum analyzer typically offers better sensitivity, dynamic range, and frequency resolution than the spectrum analyzer section of an MDO. For EMC compliance-grade measurements or sensitive RF receiver characterization, a dedicated spectrum analyzer remains the right tool.
Why Buy GW Instek from GSAS
GSAS Micro Systems is an authorized GW Instek partner, providing the full oscilloscope, power supply, and test instrument range with INR invoicing and local support.
- Demo units available at offices in Bengaluru, Hyderabad, Chennai, Pune, Mumbai, and Delhi NCR
- Application engineering for IoT, embedded, and EMC measurement setups
- INR invoicing with GST-compliant documentation
- Calibration coordination through NABL-traceable service
Also appears in:
Interested in GW Instek tools?
Talk to our application engineers for personalized tool recommendations.
More from GW Instek
View all →
Emulating Processor Power for Thermal Testing: Why Constant Power
7 Oct · 7 min

CRPS and Rack Power Supply Testing: The Six Tests That Matter
7 Oct · 7 min
GPU Power Board Testing: DC Input Verification Before Integration
7 Oct · 6 min
Servo Motor Inrush Current Testing: Method, Limits and Bench
7 Oct · 6 min
SuperTest Van Gogh 6.0: C23, C++23 and the C++20 Modules Gap
6 Oct · 7 min
AI Inside the Engineering Process: What Is Worth Automating, and What Still Needs an Engineer
21 Sept · 11 min