In short
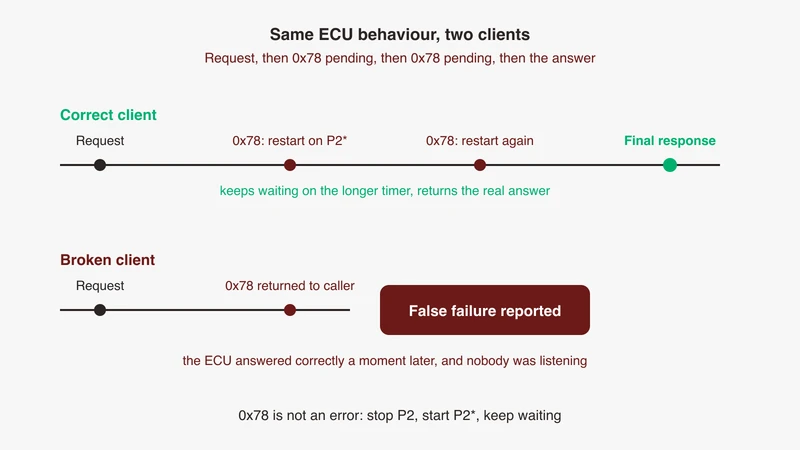
0x78 (requestCorrectlyReceivedResponsePending) is a UDS negative response telling the tester the ECU is still working: the client must stop the P2 timer, restart on the longer P2* timer, and keep waiting for a final response. It is not a failure, and a client that returns it to the caller or keeps counting down P2 will report a timeout for a request the ECU answered correctly a moment later.
Your script sends a request. The ECU answers 7F 36 78, then answers properly half a second later. Your framework reports a timeout anyway, and the test run goes red for a request the ECU handled correctly.
Search for what happened and you land in library bug threads. One reporter suspects the connector is returning the pending frame to the caller, another gives up on the wrong timer, and each thread fixes one library and stops. None writes down the protocol-level rule they are all trying to implement.
This article is that rule: what the two timers are, what the client must do when a 0x78 arrives, and the four ways real clients get it wrong, each with the log line that identifies your case. Our NRC table owns the full negative response code lookup; this page owns the timing behaviour behind one of them. For the services and sessions underneath, start with our UDS explainer.
One rule about numbers, up front. ISO 14229 is a paid document, so no millisecond default is quoted here from it. Every timing value below comes from the ECU’s own session control response, the public AUTOSAR Classic Platform Diagnostic Communication Manager specification, or the documented configuration of an open source client library. Where a number would have to come from the standard, this article tells you where to read it off your own bench instead.
What 0x78 is and why an ECU sends it
The name says received, not refused
0x78 is requestCorrectlyReceived-ResponsePending. Read the first half of that name before the second. The ECU decoded your request, accepted the service, accepted the parameters, and has started work. The only thing it is telling you is that the answer is not ready yet.
It arrives in the shape of a negative response, three bytes starting with 0x7F, which is the entire source of the confusion. Test frameworks that branch on “is byte one 0x7F” treat it as a refusal and abort. The frame is negative in encoding only; semantically it is flow control.
What an ECU is doing while it pends
The AUTOSAR Diagnostic Communication Manager specification describes the mechanism from the server side. Requirement SWS_Dcm_00024 states that if the application is able to perform the requested diagnostic task but needs additional time to finish it and prepare the response, the DSL submodule sends a negative response with NRC 0x78 when it reaches the response time, calculated as the session’s P2ServerMax less a configured transmission adjustment, or P2*ServerMax less its own adjustment for subsequent pendings.
Two things follow. A well behaved ECU sends the pending frame slightly before its declared deadline, not at it, because DcmTimStrP2ServerAdjust exists precisely to represent the delay between the stack initiating transmission and the message actually reaching the bus. And the specification requires pending responses to be sent from a separate buffer, so emitting them does not disturb the response the application is still building.
The application can also ask for one directly. The specification describes an operation returning the error status DCM_E_FORCE_RCRRP, which makes the stack transmit a pending response immediately rather than waiting until just before the response time. That is why a routine can start pending within milliseconds on some ECUs and only near the deadline on others. Both are correct.
On a bench, the work behind a pending sequence is usually a memory erase, a long routine, a read that needs a slow peripheral, or a security operation.
P2 and P2*, the two timers in plain language
There are four timers in play, not two, and half the arguments about 0x78 come from two engineers using the same name for different ones. Two run in the tester: P2 is how long it waits after sending a request before it has seen anything at all, and P2* is the longer window it uses once a pending frame has arrived. Two run in the ECU: P2ServerMax and P2*ServerMax are the matching obligations, the deadlines by which it must have put something on the bus.
| Timer | Who runs it | Starts on | Stops on | Where its value comes from |
|---|---|---|---|---|
P2 (p2_timeout in python-udsoncan) | Tester | Sending the request | The first response of any kind: positive, negative, or 0x78 | The ECU’s session control response when server timing is enabled, otherwise client configuration |
P2* (p2_star_timeout) | Tester | Receiving a 0x78 | The next response of any kind | The same session control response, second field, otherwise client configuration |
P2ServerMax (DcmDspSessionP2ServerMax) | ECU | Receiving the request | Sending a response, or sending 0x78 just before expiry | The ECU’s own per-session configuration |
P2*ServerMax (DcmDspSessionP2StarServerMax) | ECU | Sending a 0x78 | Sending the next response | The ECU’s own per-session configuration |
Outer bound (request_timeout) | Tester | Sending the request | Any final response | Client policy alone, not a protocol value |
The AUTOSAR parameter definitions for both ECU-side values say the same thing in the same words: the value is a per-session float in seconds, reported to the tester within the response to the Session Control service. DcmDspSessionP2ServerMax is defined with a range of 0 to 1 second and DcmDspSessionP2StarServerMax with a range of 0 to 100 seconds, which gives the intended shape of the pair without opening the paid standard: a short first deadline and a much longer extended one.
Reading the values your ECU actually declares
The positive response to DiagnosticSessionControl carries the session echo and then four bytes of timing. python-udsoncan unpacks them as two big-endian 16-bit values, treats the first as milliseconds and the second as tens of milliseconds, and stores the pair as the session timing.
Work an example through. A tester sends 10 01 and the ECU replies:
50 01 00 32 00 C80x50 is the positive response to service 0x10. 0x01 echoes the default session. 0x0032 is 50, so P2 is 50 ms. 0x00C8 is 200, scaled by ten, so P2* is 2000 ms. That is not a guess: a log posted on python-udsoncan issue 87 shows exactly this response and the library’s own next line reading DiagnosticSessionControl<0x10> - Received new timing parameters. P2=0.050s and P2*=2.000s. Using these value from now on.
That single line is the honest answer to “what are the P2 values”. They are whatever your ECU just said they are. Print them.
The client rule, restated as an algorithm
Written out, the obligation is four lines long:
send(request)
deadline = now + P2

loop:
    response = wait_until(deadline)

    if nothing arrived by deadline:
        report a timeout, naming which timer expired
        stop

    if response is 0x78:
        deadline = now + P2*      # restart, do not decrement
        continue                  # discard the frame, keep waiting

    return response               # positive or negative, this is the answer
Three details in that sketch are the ones clients get wrong. The 0x78 frame is discarded, not returned. The new deadline is computed from now, so every pending frame buys a fresh P2* rather than eating into a shared budget. And a timeout is reported only on expiry, never on the arrival of a pending frame.
python-udsoncan implements it almost line for line. Inside its request loop, a 0x78 is the one negative code that does not raise NegativeResponseException. Instead the loop’s done flag is cleared, and on the first pending frame the single-request timeout is set to the P2* value, taken from the session timing if the server supplied one and from configuration otherwise, with a log line saying so. Later pendings restart that same window without repeating the switch, so expect one switched-to-P2* line per request, not one per pending frame. On the next iteration it calls wait_frame again with that timeout, which is what makes each pending frame restart the window rather than share it.
The library also exposes an nrc78_callback, documented as being called each time the server returns 0x78, after which the client goes back into a wait state. Its documented use is to send a TesterPresent before blocking again, which matters wherever the session timeout is shorter than the operation you started.
Four ways clients get this wrong
1. The pending frame escapes to the caller
The pending frame is handed to the application as the final response, so a request that succeeded a moment later is recorded as a negative response.
2. It keeps counting down P2 after a pending arrived
The client saw the 0x78, kept its original short window, and gave up while the ECU was still working.
This is easy to identify because a well written client names the timer in the failure. python-udsoncan raises its timeout with the kind set to 'P2* timeout' when it is already in the extended wait and 'P2 timeout' when it is not, which surfaces as a timeout naming the kind (the older builds in the cited logs phrase it Did not receive response in time. P2 timeout time has expired; current builds phrase it Did not received frame in time (P2 timeout=1.000 sec)). Grep for the timer name, not the sentence. Seeing the P2 wording after a pending frame appeared in the capture is the tell.
Two causes produce a premature P2 expiry, and in both of the threads below no pending frame was involved at all, which is itself the point: if the P2 wording appears and the capture has no 0x78 in it, the bug is in the timer setup, not in the pending handling. One is configuration that never applied: the report on python-udsoncan issue 115 sets its options as config['p2_timeout '] and config['p2_star_timeout '], with a trailing space inside the key, so the intended five seconds never reached the client and it timed out on the library default of one second. The other is a P2 the host cannot honour. On issue 87 the ECU declared 50 ms, the reporter’s log showed roughly 49 ms elapsing between the connection layer handing over the frame and the CAN driver actually sending it, and the maintainer replied that 50 ms is a very short timeout and that a 16 ms thread resolution on Windows makes it hard to respect. Their suggested fix was to stop honouring the server timing and use local values.
3. It counts pending frames instead of restarting the timer
A client that allows, say, ten pendings and then fails has invented a rule that is not the protocol’s. The bound belongs on wall-clock time, not on frame count.
The counting bound does exist, but it belongs to the ECU. DcmDslDiagRespMaxNumRespPend is defined in the AUTOSAR specification as the maximum number of 0x78 responses allowed for one request, and requirement SWS_Dcm_00120 states that on reaching it the Dcm stops processing the active request, informs the application by setting the operation status to cancel, reports a runtime error, and sends a final NRC 0x10, generalReject. A value of zero means the ECU sends no pending responses at all.
Symptom to look for. If a long sequence ends in 7F xx 10, the ECU hit its own limit and told you so, and the bug is on the ECU side. If your client stops while pendings are still arriving on the wire, the counter is yours.
4. No upper bound at all
The opposite failure. A stuck ECU that pends forever hangs the test rig until someone notices.
python-udsoncan’s answer is a separate outer timeout. request_timeout is documented as the maximum time to wait for a response of any kind, and the documentation is explicit that it triggers even when the server has requested a wait with 0x78, and that setting it to None disables that protection. The failure it raises is named distinctly, as Global request timeout time has expired, so the log says which of the two bounds ended the request. Set it deliberately: long enough to cover the slowest legitimate operation in your sequence, short enough that an unattended overnight run cannot stall on one ECU.
An exception type that skips the timer logic entirely
python-udsoncan’s request loop catches its own TimeoutException so it can re-raise a timeout that names which timer expired, and re-raises anything else untouched (except Exception as e: raise e). That exception is a plain subclass of Exception, unrelated to Python’s builtin TimeoutError, so a transport that raises the builtin one escapes send_request unwrapped, before the client can name the timer or apply its suppress-positive-response handling.
python-doipclient fixed exactly that mismatch. Reported against suppress_positive_response=True, but the fix matters for every wait: until July 2025 the python-doipclient udsoncan connector let Python’s builtin TimeoutError propagate out of specific_wait_frame, where udsoncan only recognises its own TimeoutException. The commit that changed this, merged and released on 1 July 2025, is titled “Use TimeoutException for the udsoncan connector instead of TimeoutError”, and the pull request body states the mismatch plainly: udsoncan expects its internally defined TimeoutException while doipclient raised the standard error.
Symptom to look for. A traceback whose innermost frame raises a bare TimeoutError from the transport, rather than a clean library timeout message, and no line anywhere in the log saying the client switched to P2*.
Over DoIP, the extra layers that move the deadline
The UDS rule does not change over Ethernet. What changes is how many other deadlines are stacked underneath it. For the vehicle network those frames travel over, see our note on Ethernet-based vehicle communication.
The first is the acknowledgement. DoIP adds its own, and payload type 0x8002 is the diagnostic message positive acknowledgement, distinct from anything UDS does, as our DoIP explainer sets out. It confirms the transport carried your request. It is not the diagnostic response, and conflating the two makes a pending sequence unreadable.
python-doipclient keeps them apart, and the split is visible in its API. Sending transmits the diagnostic message and then loops until it sees the 0x8002 acknowledgement addressed to it, with its own timeout defaulting to A_PROCESSING_TIME, which the library defines as 2 seconds. Receiving the UDS response is a separate call with a separate timeout, and that is the one udsoncan drives with P2 and P2*. Worth knowing when reading a traceback: the send path’s timeout message also says it timed out waiting for a diagnostic response, even though it was waiting for the acknowledgement.
Underneath both sit TCP retransmission and the DoIP alive check, payload types 0x0007 and 0x0008, with T_TCP_ALIVE_CHECK defined in the same library as 0.5 seconds. python-doipclient answers an alive check request automatically while reading, which is what you want during a long pending sequence.
This is where a sequence that is fine on CAN can still fail on Ethernet, and python-doipclient issue 14 is the worked example. The reporter hit an immediate timeout on TransferData while flashing over Ethernet, and their first hypothesis was that the connector was returning the pending frame instead of waiting. From sniffing a factory tool they knew the ECU pends within about 0.3 seconds and answers about 0.5 seconds later, comfortably inside the client’s budget. The maintainer replied that the DoIP layer is indifferent to the UDS interaction, that the pending response essentially extends the P2 timeout, that udsoncan handles it, and pointed at use_server_timing, p2_timeout and p2_star_timeout.
Their follow-up is the part worth reading. Pending handling turned out to be working correctly in the versions they had, and the real cause was the vehicle timing out the connection: their gateway needed a periodic broadcast TesterPresent, the client tied one logical address per connection, and closing the broadcast connection to work on a specific ECU let the gateway drop the TCP session mid-operation. They fixed it by sending the keepalive to the broadcast address inside the same DoIP session, and the thread stays open as an enhancement request for gateway-style clients addressing several ECUs on one socket.
The lesson generalises past that vehicle. A pending sequence over DoIP has to survive not only P2* but the session keepalive and the socket, and if the transport dies underneath, the client reports a timeout that is true and diagnostically useless.
Routing activation failures are a different problem, one where the session never opens at all, and they have their own response code table.
Timing values are ECU-declared, not universal
Two ECUs on the same bus can legitimately want different waits, and one ECU can want different waits in different sessions. The AUTOSAR parameters are defined per session row, and the send confirmation for a session change sets the new session type and the new P2 and P2* pair together.
That makes caching across a session change a bug. python-udsoncan gets this right: on each session control response, when server timing is enabled, it overwrites its stored P2 and P2* with the newly received pair. Before any session change, or when the client is configured for an older standard version, it falls back to configuration.
The practical rules follow directly. Read the pair from the response rather than hardcoding it, read it again after every session change, and log the values you are actually using so a failing run can be compared against the capture. Keep the outer bound above the largest P2* any session on that ECU declares, because the library documentation is explicit that no timeout can exceed the overall request timeout.
Turning server timing off is a legitimate choice when the declared P2 is shorter than your host can honour, which is what the maintainer recommended on issue 87. Make it an explicit, commented decision rather than a value someone lowered once to make a red test pass.
Proving it on the wire
A client log alone cannot settle this, because the client is one of the suspects. You need the capture next to it.
Capture on the interface that carries the diagnostics, then measure two intervals: request to first 0x78, and last 0x78 to the final response. In Wireshark, select the request frame and set a time reference on it. The user guide describes a time reference as the starting point for subsequent packet time calculations, marks the referenced packet with *REF* in the Time column, and shows every following packet as elapsed time since that reference. Switching the time display format to seconds since the previous displayed packet gives the gap between consecutive pendings directly.
A healthy sequence looks regular. Pendings arrive at a roughly constant cadence, each inside the P2* the ECU declared, and the final response arrives before the next pending was due. A stalled sequence stops sending pendings and nothing follows, which is an ECU that stopped servicing the request rather than a slow one.
Then put the two stories side by side. Log the client’s timer state, which value it is using and when it switched, alongside the capture timestamps. When they disagree, the disagreement is the finding. python-udsoncan issue 115 shows what that looks like: the reporter’s log has a RoutineControl request going out, a TesterPresent response from a separate thread arriving and being matched as a positive response for TesterPresent, and the routine then timing out on P2 with its real answer nowhere. The maintainer’s diagnosis was structural rather than about timing: three clients sharing one connection, each closing it on exiting its with block, and threads needing a mutex so no request goes out while another is waiting.
Two lessons follow for any test rig. A shared connection with per-call client objects will close the connection under a request that is still waiting. And interleaving requests on a shared connection means a response can be matched by whichever client is reading, while the request that is still waiting sees nothing. The maintainer’s fix is one client for the whole program plus a mutex, not per-call client objects.
Where GSAS fits
GSAS Micro Systems is an engineering partner to validation, integration and diagnostics teams in India, and this specific split is one our applications engineers spend real bench time on: deciding whether a red test is the ECU holding you longer than it declared, or the client ending its wait one frame early.
If you have a capture and a tester log that disagree, that is the useful thing to bring. We work through them with your team, separate the ECU behaviour from the client behaviour, and get the sequence to a state where it either reproduces on demand or passes for a reason you can name. The same applies to diagnostic bring-up on a new bench. If the same exchange has to run over a telematics box rather than a bench cable, our AutoPi TMU CM4 deep dive covers that hardware. Our engineers work IST hours, and quotations are issued in INR.
We support teams in Bengaluru, Pune, Chennai and Hyderabad. Start with our automotive Ethernet capabilities, or request a consultation.
References
- python-doipclient, issue 14, handling pending messages from an ECU: github.com/jacobschaer/python-doipclient/issues/14
- python-doipclient, pull request 59, using TimeoutException in the udsoncan connector: github.com/jacobschaer/python-doipclient/pull/59
- python-doipclient source, client, connector and constants: github.com/jacobschaer/python-doipclient
- python-udsoncan, issue 115, P2 timeout expiry with a shared connection: github.com/pylessard/python-udsoncan/issues/115
- python-udsoncan, issue 87, P2 timer and host-side latency: github.com/pylessard/python-udsoncan/issues/87
- python-udsoncan documentation, client configuration and session timings: udsoncan.readthedocs.io/en/latest/udsoncan/client.html
- python-udsoncan source, request loop, default client configuration and DiagnosticSessionControl decoding: github.com/pylessard/python-udsoncan
- AUTOSAR Classic Platform, Specification of Diagnostic Communication Manager, R24-11: autosar.org/fileadmin/standards/R24-11/CP/AUTOSAR_CP_SWS_DiagnosticCommunicationManager.pdf
- AUTOSAR Classic Platform standards index: autosar.org/standards/classic-platform
- Wireshark User’s Guide, time display formats and time references: wireshark.org/docs/wsug_html_chunked/ChWorkTimeFormatsSection.html
Also appears in:
Building for Automotive & Mobility?
Talk to our application engineers for personalized tool recommendations.