Why BLE Power Measurement Is Difficult
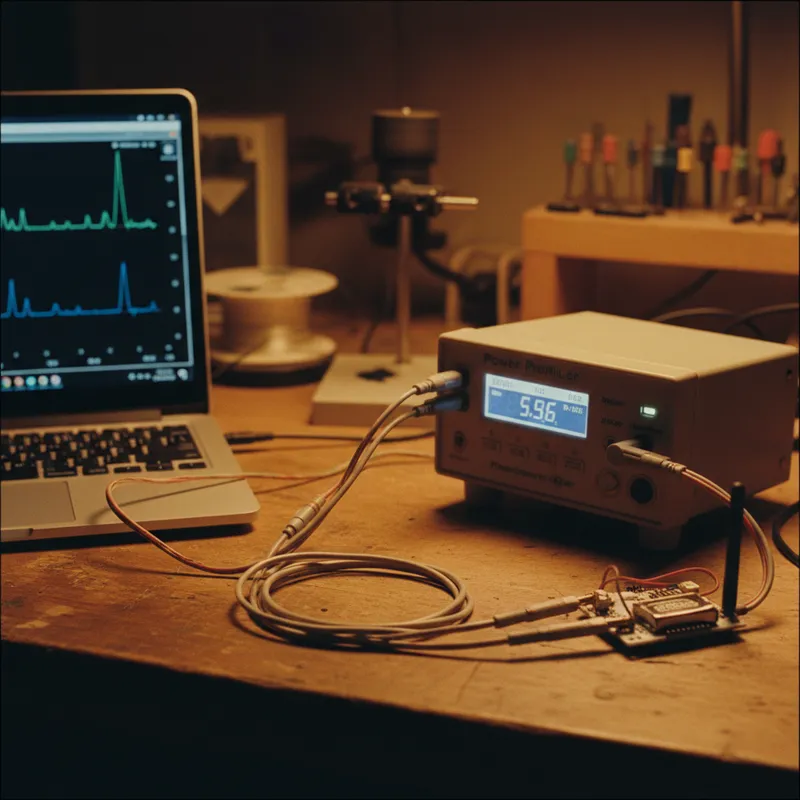
Bluetooth Low Energy is designed for low power, but achieving low power in practice requires careful measurement and optimization. A BLE device’s power profile is not a single number, it is a sequence of short, high-current events (advertising, scanning, connection events) separated by long sleep periods. The challenge is that BLE events are brief (1 to 5 milliseconds for an advertisement, a few hundred microseconds for a connection event) and the current transitions are fast (rising from sleep current to radio transmit current in microseconds).
A multimeter measuring DC current sees the time-averaged value, some fraction of a milliamp that tells the engineer almost nothing about the individual events contributing to power consumption. An oscilloscope with a shunt resistor can resolve the events but lacks the dynamic range to simultaneously measure nanoamp sleep currents and milliamp transmit currents. The Joulescope JS220 solves both problems: 2 Msps sampling resolves every BLE event with microsecond precision, and 34-bit dynamic range captures sleep currents and transmit bursts in the same measurement.
BLE Power Budget Anatomy
Advertising
When a BLE peripheral advertises, it transmits an advertising packet on each of the three advertising channels (37, 38, 39) in sequence. Each transmission is a brief current pulse, typically 5 to 12 mA for 100 to 300 microseconds depending on the payload size and PHY (1M PHY or Coded PHY). The total advertising event including channel switching takes 1 to 4 milliseconds.
The advertising interval, the time between advertising events, is the primary knob for power optimization. A 100 ms advertising interval makes the device discoverable quickly but consumes significantly more power than a 1000 ms interval. The Joulescope captures individual advertising events, allowing the engineer to measure the exact energy per advertisement and calculate the power cost of any advertising interval.
Connection Events
Once a BLE connection is established, data exchange occurs during connection events at the connection interval (7.5 ms to 4000 ms). Each connection event includes a packet exchange, the peripheral sends data, the central acknowledges (or vice versa), with the radio drawing 5 to 12 mA during transmission and 5 to 8 mA during reception.
The connection interval, slave latency (the number of connection events the peripheral can skip), and supervision timeout together determine the connection power profile. The Joulescope captures individual connection events, revealing the energy cost of each and the effect of slave latency on average power consumption.
Sleep Current
Between events, the BLE SoC enters a low-power sleep mode. Modern BLE SoCs (Nordic nRF52/nRF53 series, TI CC26xx, Dialog DA14xxx, Silicon Labs EFR32BG) specify sleep currents ranging from 0.3 uA to 2 uA depending on the retention mode and active peripherals. The Joulescope’s 0.5 nA resolution measures the actual sleep current, which often differs from the datasheet specification due to external circuit leakage, GPIO configuration, and peripheral state.
Sleep current dominates the average power budget for duty-cycled BLE devices. A device advertising every 1 second spends 99.7% of its time in sleep. If the sleep current is 1 uA higher than expected, due to a GPIO pull-up on a floating input, or an unused peripheral that was not properly powered down, the battery life impact is measured in months.
Peripheral Power
External peripherals, sensors, displays, LEDs, actuators, often consume more energy per active event than the BLE radio itself. A temperature sensor that draws 200 uA for 50 ms to take a reading consumes 10 nC per measurement. A humidity sensor that requires 100 ms at 300 uA for a reading consumes 30 nC.
If these peripherals are powered from GPIO pins, the Joulescope captures their power consumption as part of the total device profile, enabling the engineer to identify whether the radio or the peripherals are the dominant energy consumer.
Measurement Methodology
Step 1: Isolate the BLE Stack
Before measuring the complete application, measure the BLE stack alone: advertising without any application payload, connecting without data transfer, sleeping without peripheral activity. This establishes the radio baseline, the minimum power budget for BLE connectivity.
Step 2: Add Peripheral Activity
Enable the application’s sensor readings, data processing, and peripheral interactions one at a time. After each addition, capture the power profile with the Joulescope and measure the incremental energy cost. This identifies the relative contribution of each function to the total power budget and highlights any functions that consume disproportionate energy.
Step 3: Optimize the Dominant Consumer
The measurement data reveals which function dominates the power budget. If it is the advertising (common in beacon applications), optimize the advertising interval, payload size, and transmit power. If it is the sensor (common in environmental monitoring), optimize the sensor duty cycle, power supply gating, and data acquisition sequence.
If it is the sleep current (common when the design is otherwise well-optimized), investigate GPIO configuration, unused peripherals, and external circuit leakage.
Step 4: Validate With Long-Duration Capture
After optimization, capture a long-duration power profile (1 hour or more) to verify that the optimized power consumption is stable and that no infrequent events (firmware timers, stack maintenance operations, environmental triggers) are consuming unexpected energy. The Joulescope’s unlimited capture duration and lossless JLS file format make this practical.
Common BLE Power Pitfalls Revealed by Joulescope
- DCDC converter not enabled: Many BLE SoCs include an integrated DC-DC converter that reduces active current by 20-40% compared to the LDO. If the firmware does not explicitly enable the DC-DC, the device operates on the less efficient LDO. The Joulescope shows this as elevated current during every active event.
- System ON vs System OFF sleep: Using System ON sleep (with RAM retention) instead of System OFF (without RAM retention) when the application does not need RAM retention wastes microamps of sleep current.
- Floating GPIO pins: Unconnected GPIO pins left in a default input configuration can draw microamps of leakage through the input buffer. Configure unused pins as outputs driven low or as disconnected inputs.
- Unnecessary advertising during connection: Some BLE stacks continue advertising after a connection is established (for multi-connection support). If multi-connection is not needed, disabling advertising during connection saves significant energy.
Why Buy Joulescope From GSAS
GSAS provides Joulescope instruments with INR invoicing and application support from offices in Bengaluru, Hyderabad, Chennai, Pune, Mumbai, and Delhi NCR. Our team helps BLE product teams set up measurement workflows for power optimization during firmware development.
Contact sales@gsasindia.com or call +91 80 6590 1783.
Also appears in:
Interested in Joulescope tools?
Talk to our application engineers for personalized tool recommendations.
More from Joulescope
View all →
Battery Discharge Profiling for Coin Cell Devices: From CR2032 to 10-Year Life
5 Apr · 7 min
Energy Harvesting and Power Measurement: Designing Self-Powered IoT Devices
5 Apr · 7 min

IoT Battery Life Testing: A Practical Methodology for Indian Product Teams
5 Apr · 7 min

IoT Power Consumption Trends: Why Indian Product Teams Need Better Measurement
5 Apr · 7 min

Emulating Processor Power for Thermal Testing: Why Constant Power
7 Oct · 7 min

CRPS and Rack Power Supply Testing: The Six Tests That Matter
7 Oct · 7 min