In short
To capture in-vehicle Ethernet you need two things: something that turns a 100BASE-T1 or 1000BASE-T1 pair into standard Ethernet a host NIC can receive, and a capture path that preserves VLAN tags, error frames and timestamps. The four methods are a media converter, a switch mirror port, an active tap and a dedicated capture module. Wireshark itself is not the constraint: a T1 frame is ordinary 802.3 once it is off the wire, and pcap stores it as regular Ethernet.
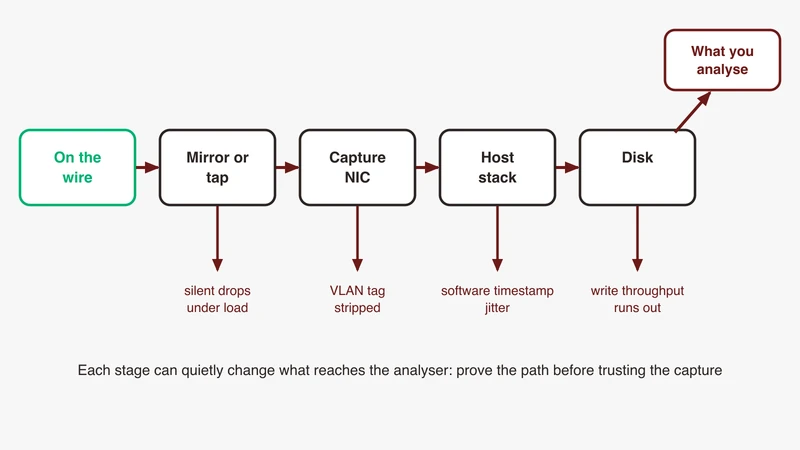
A capture that is obviously broken is easy. You get nothing, you find the cable. The captures that cost weeks look right: frames arrive, timestamps increment, the analyser decodes them, and the conclusion you draw is wrong because something in the capture path quietly removed information before you saw it.
There are four such somethings, and all four are documented. A mirror port drops frames under load and leaves no marker. The capture NIC strips the VLAN tag in hardware before the frame reaches the capture library. A software timestamp carries the jitter of the host’s scheduler. And a 100BASE-T1 or 1000BASE-T1 pair cannot be received by an ordinary NIC at all, which is the one failure honest about itself.
This article is the method: decide the job, pick from the four ways to get the frames, then check the things that make the result untrustworthy. Every claim traces to a source named at the end.
Decide what you are capturing before you buy anything
There are three jobs, and three different answers.
Protocol debugging. What was in the frames, roughly in what order. Did the offer go out, what did the ECU reply, which service ID. Content is load bearing, arrival time is context. Almost any capture path works, provided the frames are complete and the tags survive.
Timing analysis. Inter-frame gaps, cycle jitter, scheduler windows, gPTP message intervals, response latency. Arrival time is the measurement, and a path that changes frame timing, or timestamps in host software, measures itself rather than the network.
Long-duration logging. A drive cycle, an overnight soak, a fleet trial. The constraint is sustained write throughput, and the failure mode is a capture that silently starts dropping an hour in.
One question settles most of the choice: does anything in your analysis depend on when the frame arrived, or only on what it contained? If only on what it contained, a mirror port is defensible. A network-visibility vendor’s whitepaper, cited in the References, says monitoring products successfully use mirroring for low-bandwidth application-layer work where real time and knowing real delta times are not important, and the Wireshark wiki summarises the same position as monitor ports being acceptable for connection studies. If timing matters at all, you are in tap or capture-module territory.
Four ways to get the frames
Media converter. A T1 port on one side, standard Ethernet on the other, so your capture host sees a normal interface. The simplest way to get one link onto a normal NIC, and the usual starting point for a single-link bench. It contains a T1 PHY, so it has a master or slave role of its own that has to pair with the device under test, which is the subject of our 100BASE-T1 bring-up checklist.
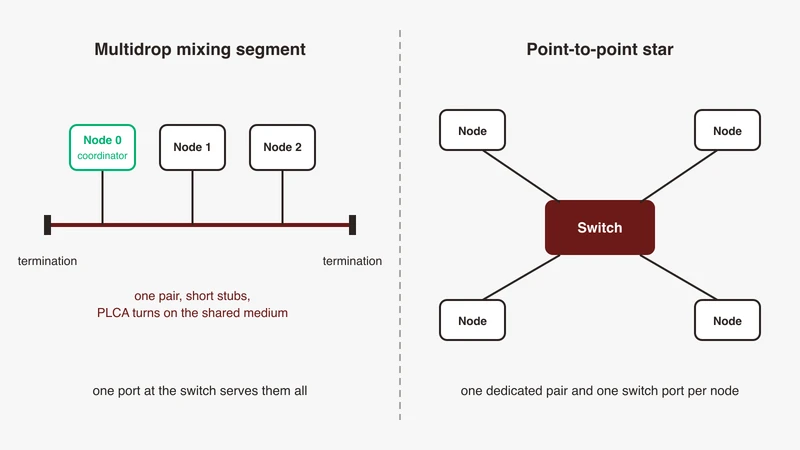
Mirror or SPAN port. A managed switch copies traffic from one or more ports to a monitor port. The Wireshark wiki gives one hard rule up front: the monitoring port must be at least as fast as the monitored port, or you will certainly lose packets. It also warns that some switches mirror only traffic on a particular port rather than all traffic through the switch.
Active tap. A purpose-built device inserted in line that copies traffic to one or more monitor outputs. The Wireshark wiki lists breakout, aggregation, replicating, bypass and media-changing types, and notes a breakout tap has four connectors, two for the line and two outputs, one per direction.
Dedicated capture module. Built for vehicle capture: several T1 ports, its own timestamping, its own encapsulation, usually its own recording. Treated here as a market category, because the honest answer to most fidelity questions about a specific module is to ask the vendor and get it in writing.
| Method | Timestamp source | Behaviour under load | Tag and error-frame fidelity | Intrusive to the link | Typical use |
|---|---|---|---|---|---|
| Media converter plus host NIC | Capture host; hardware class only if the NIC has a PTP hardware clock, and the converter’s own latency sits in front of it | Symmetric rate, so no oversubscription in the converter itself; the limit moves to the host buffer and disk. Converter latency and its variability are a vendor question | Depends on NIC, driver and OS: many strip VLAN tags and discard bad frames by default, and the remedy is vendor-specific | Yes: the link is broken to insert it, and the converter’s PHY needs the correct role | Protocol debugging on one link |
| Switch mirror or SPAN port | Capture host, and the mirror path itself alters frame timing | Mirrored frames dropped when the destination port is oversubscribed, first in first out once the egress buffer is exceeded | Documented as not passing bad, long or short frames, and as not passing VLAN tags, though a counter-argument on the same wiki page answers that many switches can be configured to mirror the tags | No cable break, but a configuration change on a switch also carrying the traffic | Presence and absence, connection studies, temporary access |
| Active tap | Applied by whatever captures the tap output, unless the tap timestamps itself: ask | Vendor claim for a purpose-built tap is that it passes all traffic regardless of bandwidth | Vendor claim is all packets including error packets, interframe gap neither dropped nor altered: verify on the unit you buy | Yes: test power-up and power-down transparency | Timing-sensitive and error-frame work on one link |
| Dedicated capture module | Ask which class, and where in the path it is taken | Ask what happens on overload: silent drop, or a marked gap in the file | Ask what it does with tagged frames, runts and bad CRCs, and what encapsulation it emits | Ask whether it taps or bridges | Multi-link and in-vehicle capture |
Four of those cells are questions rather than answers, deliberately: capture module behaviour varies per product, and we are not going to invent a specification for a category.
Why mirror ports lose packets when it matters
The arithmetic is the whole argument. A full-duplex link carries traffic in both directions at once, so the worst case a mirror has to reproduce is twice the link rate. That same whitepaper states it plainly for the IT case: a full-duplex gigabit link is 2 Gbit of data and a 10 Gbit full-duplex link is 20 Gbit of potential data flows. For a fully loaded 100BASE-T1 link, both directions mirrored into one port is 200 Mbit/s. A gigabit monitor port absorbs that comfortably. Four such links aggregated into the same monitor port do not leave the same margin, and 1000BASE-T1 changes the sum again.
When the destination port cannot keep up, the drops are neither random nor announced. The whitepaper gives the mechanism: when traffic aggregated from the source ports exceeds the physical limitations of the destination port, the result is dropped packets on the destination port, discarded first in first out once the egress buffer limit is exceeded, without degrading the source ports at all. It also quotes a major switch vendor’s own documentation to the effect that the switch treats mirrored data at a lower priority than regular port-to-port data, so under load the mirrored copy loses.
The drop happened inside the switch, before anything wrote a file, so there is no marker in the capture. A missing response looks identical to a response that was never sent, which is the wrong ambiguity to bring into a debug session.
Timing is distorted even when nothing is lost. The whitepaper reports a comparison on a 100 Mbit/s link running a sustained 93.1 Mbit/s throughput test: 133,126 packets through a tap against 125,221 through a mirror on the same switch, which it reports as almost 8 percent of packets missing, with no error frames and the switch bus not near overload. In the same test the delay between the TCP handshake frames read 243 microseconds through the tap and 221 through the mirror, meaning the switch forwarded to the monitor port faster than to the real destination. The principle in the same document is the part to keep: any active device that touches a frame has changed the frame timing, and what matters is whether that change is constant, because a variable offset is what destroys time-based analysis.
None of which makes a mirror port useless. It answers “did this ever appear” quickly, needs no cable break, and is the only option when you cannot reach the link. The whitepaper’s own position is that mirroring is usable within its parameters and was not intended for long-term use. Use it for presence and absence, then stop trusting it the moment a number in your analysis comes from a timestamp.
Why your VLAN tags disappear
This one catches good engineers because the evidence points at the network. Wireshark shows untagged frames on a network you know is tagged, you audit the switch configuration, and the configuration is fine. The tag was removed by your own adapter. The Wireshark wiki is direct about it: many network adapters strip off the VLAN tag by default after receiving a packet, and on the host where the VLANs are configured you will probably not see the tags even when capturing on the physical device, because the driver is stripping the tags before the pcap library sees them. Whether you see tags on the raw device, it adds, “depends on the NIC, the NIC firmware, the driver”.
An adapter vendor’s support article documents the same behaviour and the remedy. Titled “My Sniffer Isn’t Seeing VLAN, 802.1q, or QoS Tagged Frames”, it does not diagnose the cause, it just documents the fix. On Windows that is a registry value on the adapter instance, named MonitorMode or MonitorModeEnabled depending on the driver family. Set to 0, both are described the same way: do not store bad packets, do not store CRCs, strip 802.1Q VLAN tags. Set to 1, MonitorModeEnabled stores bad packets and CRCs and does not strip tags, and MonitorMode receives bad, runt and invalid-CRC packets, leaves CRCs attached and does not strip tags. On Linux the same article records the inverse default: the driver in promiscuous mode does not strip VLAN tags, and it is loading the kernel 802.1q module that enables the hardware offload for tag stripping and insertion. It also points out that your capture software is responsible for putting the driver in promiscuous mode in the first place.
Read that value description again, because it does double duty. The same setting that controls VLAN tags controls whether bad, runt and invalid-CRC frames are stored at all, so a capture host in its default state is silently discarding exactly the frames you want when chasing a physical-layer fault.
The mirror path fails the same way independently. The wiki’s own page carries both sides. Its comparison of monitor ports against taps lists three properties: monitor ports do not pass bad frames, long or short frames or any malformed packets, they do not pass VLAN tags, and they change timing. A counter-argument published on the same page answers that the VLAN claim is not generally true, since on many switches the mirror can be configured to carry the tags, giving Cisco’s trunked SPAN port as the example. Treat neither as settled for your switch: configure the mirror as a trunk if you can, then prove it.
So the two-minute test is a comparison, not a lookup. Capture the same traffic twice on two paths and diff the tag column. If one shows the tag and the other does not, the difference is the capture path, and you have your answer without touching a switch. Use as reference the path with the fewest devices that could have removed anything.
One boundary: this article is about the tag reaching the capture file. If the tag is in the file and Wireshark still will not decode what sits above it, that is a dissection problem, and the fix list is in Wireshark not decoding SOME/IP.
Timestamps, three accuracy classes
Where the timestamp is taken decides what it is worth. A design house’s published overview of timestamping in multi-ECU systems makes the point that if the capture happens in application software after the frame has travelled through the OS network stack, the measurement includes all the scheduling jitter and interrupt latency the OS introduced, which it puts at typically tens to hundreds of microseconds of variability.
The same article publishes a table of achievable synchronisation accuracy by implementation path. Those figures are that vendor’s estimates for a gPTP implementation, not a specification for capture equipment, so treat them as the vendor’s published numbers and use them for the ordering rather than as a datasheet:
- PHY hardware timestamping with transparent switches: 50 to 200 ns.
- MAC-level hardware timestamping: 200 ns to 1 microsecond.
- Software timestamping on a Linux kernel: 10 to 100 microseconds, where the article notes that OS scheduler jitter dominates.
Map that onto the three jobs. Protocol debugging lives comfortably in the software class. Timing analysis does not: measuring a scheduler window or a cycle jitter budget with an instrument whose own jitter is tens of microseconds tells you about the instrument. For long-duration logging it becomes a drift question instead.
Which is the part people skip. An accurate timestamp on an undisciplined clock is still the wrong time. The same article gives a typical crystal drift of 20 to 50 parts per million, which it translates as 20 to 50 microseconds of error per second, and warns that a system can report a sub-microsecond offset in its stack log while delivering tens-of-microseconds scatter at the interface that matters. A free-running capture host has no defensible relationship to the vehicle’s clock two hours into a soak test. Discipline it to the timebase you are measuring against, and confirm that is real rather than configured: our gPTP troubleshooting guide covers checking for an actual PTP hardware clock and a receive filter that matches your traffic, and when Qbv breaks PTP covers what happens when scheduling and sync fight each other.
The media problem, and why the capture host is not the blocker
Engineers new to T1 often assume the analyser needs to understand automotive Ethernet. It does not.
The public record is ask.wireshark.org question 25298, filed on 30 November 2021, asking whether documented support for 802.3 EPON and 802.3br extended to 100 and 1000BASE-T1. A Wireshark core developer answered the next day that “Ethernet” as a generic link-layer type, LINKTYPE_ETHERNET, is independent of the physical layer, that it “can handle everything from 10BASE5 (the Big Yellow Cable) up to 400GBASE-whatever”, and that “This includes 100BASE-T1 and 1000BASE-T1”. They added that pcap and pcapng have no special link-layer type for 100 or 1000BASE-T1, so it is just treated as regular Ethernet.
So the frame format, the file format and the dissectors are fine. The obstacle is one layer down: no ordinary NIC has a T1 PHY, and no laptop has the connector. Everything on your bench that costs money is solving a physical-layer problem, not a protocol one. Our T1 family guide sets out which physical layer you are on.
Two consequences for insertion. First, whatever you insert has a role: a media converter contains a T1 PHY, 100BASE-T1 has no auto-negotiation, and exactly one side of each pair must be master. The bring-up checklist is the reference. Second, inserting anything into a live link takes it down and requires it to come back up. The wiki’s warning about taps applies to any inline device: test the power up and power down, because some are completely transparent when they power down but can take up to approximately two seconds to power up, and for those two seconds no packets pass.
A bench decision tree, and what changes in a real vehicle
On the bench, in order:
- Content only, one link, cable can be broken. Media converter into a host NIC. Prove the NIC is not stripping tags or discarding bad frames before you trust the file: on the adapter vendor’s Windows drivers that is the
MonitorModeregistry value, on Linux it is checking that the 802.1q module is not loaded on the capture interface, and on anything else it is the two-path diff above. - Content only, cable cannot be broken. Mirror port. Check the monitor port is at least as fast as the sum of what you mirror, and accept that you are not measuring time.
- Timing, error frames, or anything you will quote a number from. Active tap, with a capture path whose timestamp class you can state. Two outputs means two capture interfaces or a bonded pair.
- Several links at once, or the capture leaves the lab. Capture module, chosen against the four questions in the table, answered in writing.
The downloadable bring-up and validation checklist on our automotive Ethernet capability page includes a capture-access decision table you can keep at the bench.
In a vehicle, four things change. Power: the capture device runs off the vehicle supply and sees cranking and brown-outs, so a capture that survives a bench can end mid-file. Sleep: a link can go down mid-run by design rather than by fault, and a capture with no link-state log cannot tell a down link from a silent one, so log link state alongside the frames. Temperature, which the bench never tests. And physical access, which decides everything else, because a link you cannot reach with an inline connector is a link you will be mirroring whether you wanted to or not. Settle where the capture point sits relative to the vehicle’s switches and controllers before the vehicle is on a lift: our walkthrough of a real vehicle communication architecture shows the topology those decisions land in, and the AutoPi TMU CM4 deep dive covers logging over a telematics unit. Aligning that capture with CAN, LIN and FlexRay is a correlation problem rather than a capture one, and when the question is the waveform a scope is the instrument, which our PicoScope automotive bus decode guide covers.
Then do the storage arithmetic before the run. A 100BASE-T1 link saturated in both directions is 200 Mbit/s, which is 25 MB/s, which is 90 GB per hour of wire data before file overhead. Real links rarely run saturated, but that is the order of magnitude to budget for, and 1000BASE-T1 moves it by ten. Three controls manage it. Snaplen limits how much of each packet is stored, described in the Wireshark documentation as settable for performance or privacy reasons. Multiple-files mode switches to a new file after a number of packets, a size, a duration or at an exact multiple of a number of seconds, and forms a ring buffer of a given number of files, which is how you run unattended with bounded disk. And the capture buffer size, documented in dumpcap as 2 MiB by default with the advice to increase it if you encounter packet drops. A capture that hits the disk limit unmanaged ends where the interesting part starts.
Where GSAS fits
Method selection is a conversation about your job, not a product list. Tell us which of the three jobs you are doing, what the link is, whether you can break it, and whether anything in your analysis will be quoted as a number, and we work through the method and the bench layout with your team before anything is specified. Most of the value is in the questions above being answered in writing rather than assumed.
Our applications engineers work with automotive teams across Bengaluru, Pune, Chennai and Hyderabad on first captures and lab bring-up, including the parts that are nobody’s product: proving the tags survive your NIC, proving the timestamp class you think you have, and proving the mirror port is not dropping the frames your analysis depends on.
Our automotive Ethernet capability page sets out how we work with engineering teams, and you can request a consultation with the job description above and we will start there.
References
- ask.wireshark.org question 25298, “Does Wireshark support Automotive Ethernet 100/1000BASE-T1?”, asked 30 November 2021: https://ask.wireshark.org/question/25298/does-wireshark-support-automotive-ethernet-1001000base-t1/
- Wireshark wiki, CaptureSetup/Ethernet (switched Ethernet, monitor mode of the switch, network taps, monitor port versus network tap, sniffing 802.1Q VLAN tags): https://wiki.wireshark.org/CaptureSetup/Ethernet
- Wireshark wiki, CaptureSetup/VLAN (VLAN tags, Linux, driver stripping behaviour): https://wiki.wireshark.org/CaptureSetup/VLAN
- Wireshark User’s Guide, Capture Options (snaplen, promiscuous mode, output tab, multiple files and ring buffer): https://www.wireshark.org/docs/wsug_html_chunked/ChCapCaptureOptions.html
- Wireshark documentation, dumpcap manual page (
-bmultiple files and ring buffer,-aautostop,-ssnaplen,-Bcapture buffer size): https://www.wireshark.org/docs/man-pages/dumpcap.html - Adapter vendor support article, “My Sniffer Isn’t Seeing VLAN, 802.1q, or QoS Tagged Frames”, article ID 000005498, read via the Internet Archive snapshot of 11 June 2026 because the live page blocks automated fetches: https://www.intel.com/content/www/us/en/support/articles/000005498/ethernet-products.html
- Network-visibility vendor whitepaper, “TAP vs SPAN: Best Practice Guide to Improving Network Visibility”: https://www.garlandtechnology.com/hubfs/Current/Documents/Whitepaper/GTWP-TAP-vs-SPAN21.pdf
- Design house overview, “Sensor Timestamping and Clock Synchronization in Multi-ECU Systems: Where PTP and gPTP Break Down”, 3 April 2026: https://promwad.com/news/sensor-timestamping-clock-synchronization-multi-ecu-ptp-gptp
Also appears in:
Building for Automotive & Mobility?
Talk to our application engineers for personalized tool recommendations.