Why the JS220 Exists
Measuring the power consumption of an embedded device seems straightforward until you try to do it properly. A battery-powered IoT sensor draws 200 nA in deep sleep, spikes to 15 mA during a sensor read, bursts to 120 mA for a wireless transmission, and returns to sleep, all within a few hundred milliseconds. No single measurement instrument designed before the Joulescope could capture this entire dynamic range in a single continuous measurement without compromises.
A digital multimeter averages out the transients. An oscilloscope with a shunt resistor must choose between nanoamp resolution (large shunt, excessive burden voltage at high currents) and high-current capacity (small shunt, no nanoamp visibility). A source-measure unit can cover the range but at sample rates too slow to resolve fast transients. The Joulescope JS220 was designed from the ground up to solve this problem.
Hardware Architecture
Measurement Front End
The JS220’s measurement front end uses a patented autoranging architecture called Enwavify. Rather than using a single shunt resistor (which forces a tradeoff between resolution and burden voltage), Enwavify uses multiple precision shunt resistors optimized for different current ranges. The hardware switches between shunts in approximately 1 microsecond, fast enough that no current transient is missed and there are no gaps or glitches in the data stream.
The result is a 34-bit effective dynamic range: from 0.5 nA resolution at the low end to +/-10 A peak (+/-3 A sustained) at the high end. The instrument resolves nanoamp sleep currents and amp-level inrush transients in the same continuous measurement, without requiring the user to change ranges, reconnect probes, or reconfigure settings.
Dual 16-bit ADCs at 2 Msps
Current and voltage are measured simultaneously by two 16-bit ADCs sampling at 2 million samples per second. Simultaneous sampling is critical, if current and voltage are sampled at different times, the instantaneous power calculation (P = V x I) contains timing error, particularly during fast transients where both current and voltage are changing rapidly.
The 300 kHz analog bandwidth ensures that the instrument captures fast current spikes, ISR wake-ups, switching regulator transients, radio preamble bursts, that occur on microsecond timescales. Lower-bandwidth instruments filter out these transients, underestimating peak current and energy consumption.
Burden Voltage
The JS220 maintains a maximum burden voltage of 20 mV across its measurement path. This is the voltage drop that the instrument’s shunt resistance imposes on the target device. A 20 mV drop is small enough that it does not perturb the operating conditions of the device under test, critical for accurate low-power profiling where even small supply voltage changes can alter firmware behavior, clock frequencies, and regulator efficiency.
For comparison, a 1-ohm shunt resistor (commonly used with oscilloscopes for milliamp-range measurements) drops 100 mV at 100 mA, enough to push some voltage regulators out of regulation or cause a brownout reset on a device operating near its minimum supply voltage.
Electrical Isolation
The JS220 provides electrical isolation between the sensor measurement ports and the USB interface. This prevents ground loops between the measurement instrument and the device under test, a common source of measurement error when the DUT and the host PC share a common ground through USB. Ground loop currents can be in the microamp range, which is negligible for milliamp measurements but significant for nanoamp measurements.
Software Ecosystem
Joulescope UI
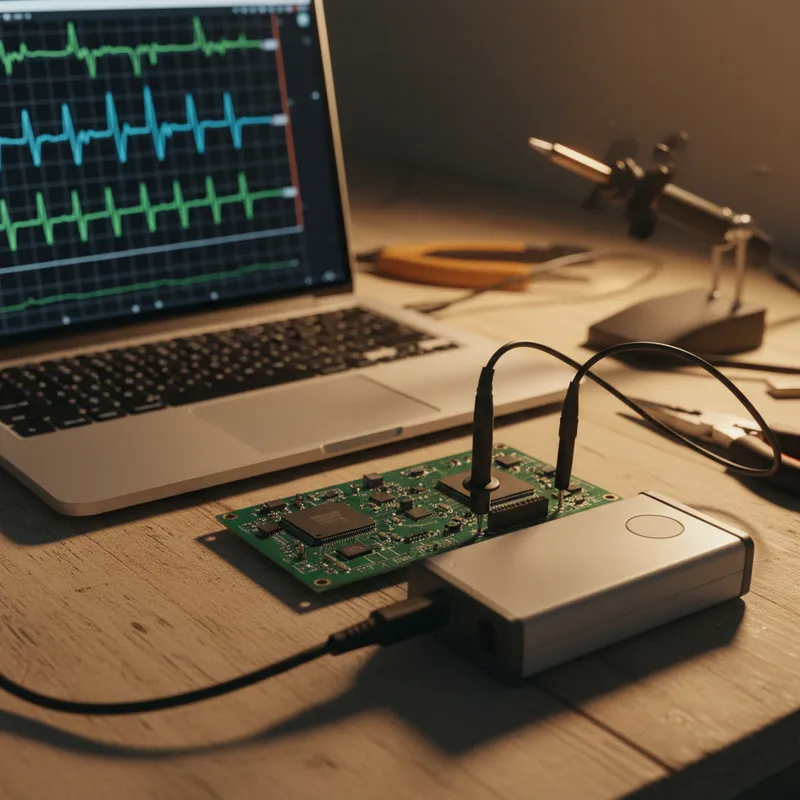
The Joulescope UI is a cross-platform desktop application (Windows, macOS, Linux) that provides real-time visualization and analysis of the measurement data. Key features include:
- Oscilloscope view: Time-domain plot of current, voltage, and power with zoom from full capture duration down to individual microsecond samples
- Statistics view: Real-time mean, standard deviation, min, max, peak-to-peak for current, voltage, power, energy, and charge over configurable time windows
- Energy accumulation: Running total of energy (joules) and charge (coulombs) consumed since the start of measurement or since a user-defined trigger
- Multimeter view: Digital readout of instantaneous and averaged values for quick checks
- Data export: CSV, JLS (native lossless format), and binary export for post-processing
The UI can display multiple views simultaneously, oscilloscope, statistics, and energy accumulation side by side, providing a complete real-time picture of the device’s power behavior.
Python API
The Joulescope Python API (pyjoulescope) provides programmatic control of the instrument for automated measurement workflows. Engineers can script complete measurement sequences: configure the instrument, start capture, trigger device operations (via GPIO or external equipment), stop capture, compute statistics, and log results, all from Python.
This API is the foundation for integrating power measurement into CI/CD pipelines. A firmware build pipeline can include a step that programs the DUT with the new firmware, runs a standardized power profile test, compares the measured energy consumption against a baseline, and flags any regression. This transforms power consumption from a one-time characterization into a continuously monitored metric.
Data Analysis and Post-Processing
The JLS file format stores the full 2 Msps data stream in a compressed, seekable format. A 1-hour capture at full sample rate produces a file that can be opened and navigated instantly, zooming from the full hour view down to individual microsecond samples without reloading data. This is essential for analyzing long-duration captures of devices with infrequent events (a LoRaWAN node that transmits once per hour, a sensor that wakes once per minute).
For advanced analysis, the Python API provides direct access to the raw sample data as NumPy arrays, enabling custom analysis in Jupyter notebooks, MATLAB integration via the Python bridge, or custom signal processing pipelines.
JS220 vs JS220+
The JS220+ variant uses Rogers PCB substrate in the measurement front end instead of standard FR-4. Rogers material has lower dielectric absorption and lower surface leakage than FR-4, which reduces the parasitic leakage currents that limit the noise floor at the lowest current ranges. The JS220+ achieves lower noise at sub-microamp currents, making it the preferred choice for characterizing the most demanding ultra-low-power designs, devices targeting sub-100 nA sleep currents.
For most IoT and embedded applications where sleep currents are in the 1-10 uA range, the standard JS220 provides more than sufficient resolution. The JS220+ is recommended for semiconductor characterization, leakage current testing, and designs targeting coin cell lifetimes exceeding 10 years.
Why Buy Joulescope From GSAS
GSAS provides Joulescope instruments with INR invoicing, evaluation units, and application support from offices in Bengaluru, Hyderabad, Chennai, Pune, Mumbai, and Delhi NCR. Our team assists with measurement setup, Python API integration, and CI/CD pipeline configuration for automated power profiling.
Contact sales@gsasindia.com or call +91 80 6590 1783 to request an evaluation unit.
Also appears in:
Interested in Joulescope tools?
Talk to our application engineers for personalized tool recommendations.
More from Joulescope
View all →
Battery Discharge Profiling for Coin Cell Devices: From CR2032 to 10-Year Life
5 Apr · 7 min
BLE Power Profiling: Measuring Bluetooth Low Energy Current With Joulescope
5 Apr · 7 min
Energy Harvesting and Power Measurement: Designing Self-Powered IoT Devices
5 Apr · 7 min

IoT Battery Life Testing: A Practical Methodology for Indian Product Teams
5 Apr · 7 min

Emulating Processor Power for Thermal Testing: Why Constant Power
7 Oct · 7 min

CRPS and Rack Power Supply Testing: The Six Tests That Matter
7 Oct · 7 min