Why Power Profiling Matters for IoT
Battery-powered IoT devices, BLE sensors, LoRaWAN nodes, Zigbee mesh endpoints, cellular NB-IoT trackers, must operate for months or years on a single battery. The difference between a device that lasts 6 months and one that lasts 3 years often comes down to sleep current. A device drawing 10 uA in sleep versus 100 uA loses 90% of its theoretical battery life before the radio even transmits.
Traditional multimeters cannot capture the dynamic current profile of an IoT device. A BLE sensor might draw 500 nA in deep sleep, spike to 15 mA during an ADC conversion, burst to 8 mA for a BLE advertisement, and return to sleep, all within 20 milliseconds. A DMM sampling at 1 Hz misses the entire active phase and reports only the sleep current.
An oscilloscope with a shunt resistor faces the opposite problem: a shunt sized for nanoamp resolution drops excessive voltage at milliamp currents, perturbing the device under test.
Joulescope JS220: Simultaneous Nanoamp and Amp Measurement
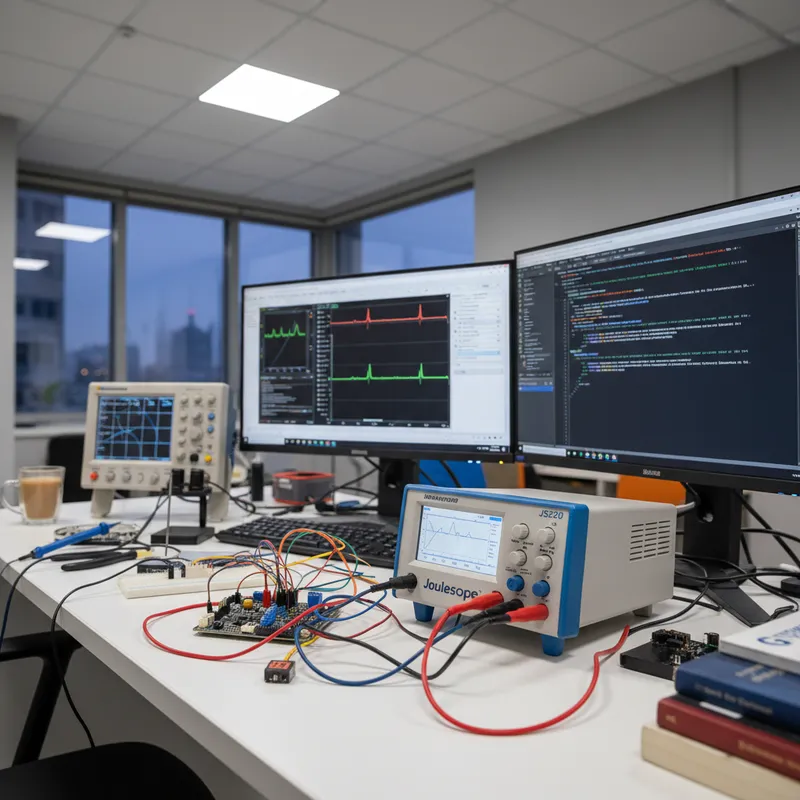
The Joulescope JS220 solves this with simultaneous current and voltage measurement across a 34-bit dynamic range, from 0.5 nA resolution to +/-10 A peak (+/-3 A sustained), with 2 Msps 16-bit ADC capture and 300 kHz bandwidth. No current spike is missed, regardless of duration.
The proprietary Enwavify autoranging technology switches between optimized shunt resistors in 1 microsecond with zero gaps in the data stream. A 20 mV maximum burden voltage ensures the target device operates within normal parameters, which is critical for accurate low-power profiling where even small voltage drops alter firmware behavior. Electrical isolation between sensor ports and USB prevents ground loops between the instrument and device under test.
Key measurement capabilities:
- Current range: 0.5 nA to +/-10 A peak in a single continuous measurement
- Voltage measurement: simultaneous with current, +/-15 V range
- Sample rate: 2 Msps with 16-bit simultaneous ADCs
- Autoranging: Enwavify, 1 microsecond switching, zero dead zones
- Software: Joulescope UI with energy integration, statistics, and export (Windows, macOS, Linux)
- Automation: Full Python API for scripted measurement, CI/CD integration, and regression testing
Practical Methodology
Step 1: Baseline Sleep Measurement
Power the device, let it enter its deepest sleep state, and measure the sleep current over 60 seconds. The Joulescope UI’s statistics view shows mean, standard deviation, min, and max current over the capture window. This baseline tells you the floor of your power budget, the current the device draws 99%+ of the time in a duty-cycled application.
Watch for unexpected periodic wake events: RTC tick interrupts, watchdog refresh cycles, or peripheral oscillator calibrations that briefly elevate current. These are invisible to a multimeter but clearly visible in the JS220’s 2 Msps capture as narrow current spikes at regular intervals.
Step 2: Active Phase Capture
Trigger an active event, sensor read, radio transmission, display update, and capture the full current profile. Use the Joulescope UI’s oscilloscope view to zoom into the event with microsecond resolution. Identify each sub-phase: MCU wake-up, oscillator settling, peripheral initialization, sensor acquisition, data processing, radio transmission, acknowledgment reception, and return to sleep.
Step 3: Energy Integration
Use the Joulescope UI’s energy accumulation feature to calculate total energy per event. Select the time window around one complete active cycle and read the integrated energy in joules or the integrated charge in coulombs. This is the per-event energy cost, a single number that captures the combined effect of current magnitude and duration across all sub-phases.
For protocols with variable packet sizes or retransmissions, capture multiple events and compute the statistical distribution. A LoRaWAN confirmed uplink that occasionally requires retransmission has a different average energy cost than an unconfirmed uplink.
Step 4: Battery Life Calculation
With the sleep current baseline and the per-event energy cost, battery life calculation becomes straightforward:
Average current = sleep current + (events per day x charge per event) / 86,400 seconds
Battery life = battery capacity (mAh) / average current (mA)
For a CR2032 coin cell (225 mAh) powering a BLE sensor that advertises every 10 seconds with 50 uC per advertisement and 800 nA sleep current, the average current is approximately 5.8 uA, yielding a theoretical battery life of about 4.4 years. The JS220 measurement tells you whether the actual device matches this calculation or whether unexpected wake events, leakage paths, or firmware bugs are consuming additional energy.
Export and Reporting
The Joulescope UI exports data in CSV, JLS (native), and binary formats for post-processing in Python, MATLAB, or custom analysis tools. The Python API enables fully automated measurement workflows, trigger a firmware operation, capture the current profile, compute energy, and log the result, suitable for CI/CD pipelines that track power regression across firmware versions.
Buy Joulescope in India from GSAS
GSAS provides Joulescope instruments with INR invoicing, evaluation units, and application support from offices in Bengaluru, Hyderabad, Chennai, Pune, Mumbai, Delhi NCR, Coimbatore, Visakhapatnam, Vadodara, and Kolkata.
Contact sales@gsasindia.com or call +91 80 6590 1783.
Also appears in:
Interested in Joulescope tools?
Talk to our application engineers for personalized tool recommendations.
More from Joulescope
View all →
Battery Discharge Profiling for Coin Cell Devices: From CR2032 to 10-Year Life
5 Apr · 7 min
BLE Power Profiling: Measuring Bluetooth Low Energy Current With Joulescope
5 Apr · 7 min
Energy Harvesting and Power Measurement: Designing Self-Powered IoT Devices
5 Apr · 7 min

IoT Battery Life Testing: A Practical Methodology for Indian Product Teams
5 Apr · 7 min

Emulating Processor Power for Thermal Testing: Why Constant Power
7 Oct · 7 min

CRPS and Rack Power Supply Testing: The Six Tests That Matter
7 Oct · 7 min