Beyond Manual Measurement
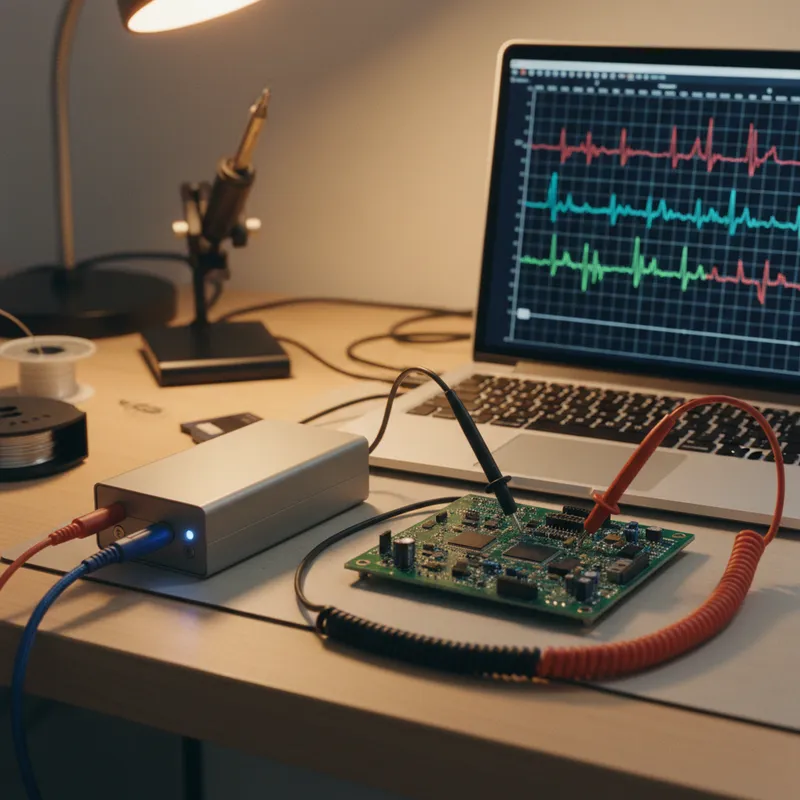
Manual power measurement, connecting the Joulescope, starting a capture, triggering the device, reading the results from the UI, works well for one-off characterization. But modern embedded firmware development is iterative. Firmware is updated weekly or daily.
Every update can change power consumption, a new peripheral driver, a modified sleep state configuration, an updated radio stack, a bug fix that inadvertently leaves a clock gate open. Without automated power measurement, each firmware update requires a manual measurement session, and regressions slip through until someone notices that battery life has degraded in the field.
The Joulescope Python API (pyjoulescope_driver) transforms the JS220 from a manual instrument into an automated measurement node that integrates into firmware build pipelines, regression test frameworks, and continuous integration systems.
Getting Started With the Python API
Installation
The Joulescope Python package installs via pip on Windows, macOS, and Linux:
pip install joulescopeThe package includes the device driver, the data acquisition interface, and utility functions for statistics computation and data export. It requires Python 3.8 or later and a USB 2.0 or USB 3.0 port.
Basic Measurement Script
A minimal measurement script opens the device, configures the sample rate, captures data for a specified duration, and computes statistics:
import joulescope
import numpy as np

with joulescope.scan_require_one(config='auto') as js:
    data = js.read(contiguous_duration=10.0)  # 10 seconds
    current = data['signals']['current']['value']
    voltage = data['signals']['voltage']['value']

    print(f"Mean current: {np.mean(current) * 1e6:.2f} uA")
    print(f"Peak current: {np.max(current) * 1e3:.2f} mA")
    print(f"Mean voltage: {np.mean(voltage):.3f} V")
The scan_require_one() function finds the connected Joulescope and opens it. The read() function captures the specified duration of data and returns it as NumPy arrays. From there, standard NumPy and SciPy operations provide any statistical analysis needed.
Energy Per Event
For duty-cycled devices, the key metric is energy per event, the total energy consumed during one complete operational cycle (wake, process, transmit, sleep). The API can compute this by integrating instantaneous power over the event window:
power = current * voltage
energy_joules = np.trapz(power, dx=1.0/js.sample_rate)
charge_coulombs = np.trapz(current, dx=1.0/js.sample_rate)
For devices with periodic events, capture multiple cycles and compute the statistical distribution of energy per event. The mean and standard deviation provide the inputs for battery life projection with confidence intervals.
CI/CD Integration
The Measurement Pipeline
A firmware CI/CD pipeline with power measurement follows this sequence:
- Build: Compile the firmware from the latest commit
- Flash: Program the DUT with the new firmware (via J-Link, ST-Link, or other programmer)
- Stabilize: Wait for the device to enter its steady-state operating mode
- Measure: Use the Joulescope Python API to capture a defined number of duty cycles
- Analyze: Compute mean current, peak current, energy per event, and sleep current
- Compare: Check measured values against the baseline thresholds
- Report: Log the results and flag any regressions
Steps 2 through 7 can be automated in a Python test script invoked by the CI system (Jenkins, GitLab CI, GitHub Actions). The Joulescope’s USB interface makes it available to any machine that can run Python and has a USB port, a dedicated test bench, a developer’s workstation, or a CI runner with physical hardware access.
Regression Detection
Define baseline thresholds for the key power metrics:
THRESHOLDS = {
    'sleep_current_ua': 2.5,      # max acceptable sleep current
    'peak_current_ma': 150.0,     # max acceptable peak current
    'energy_per_tx_uj': 500.0,    # max energy per transmission event
}
After each measurement, compare the actual values against the thresholds. If any metric exceeds its threshold, fail the CI step and alert the development team. The alert should include the measured value, the threshold, the percentage deviation, and the firmware commit hash, enabling the developer to immediately identify which change caused the regression.
Trend Tracking
Beyond pass/fail thresholds, log every measurement result to a time-series database or a simple CSV file. Over weeks and months, this data reveals trends: sleep current gradually creeping up as new features are added, energy per transmission increasing as protocol overhead grows, peak current spikes from driver changes. These trends are invisible without continuous measurement and become problems only when a customer reports reduced battery life.
Multi-Device Testing
The Python API supports multiple Joulescope devices connected to the same host. Each device is identified by its serial number, allowing scripts to address specific instruments in a multi-device test setup. This enables parallel testing of multiple DUT variants, multiple firmware configurations, or multiple operating conditions simultaneously.
For production testing, a multi-Joulescope setup can measure every unit coming off the production line, screening for units with abnormal power consumption, a proxy for manufacturing defects such as solder bridges, cold joints, or missing components that alter the power profile.
Data Export and Analysis
The API exports data in JLS (native lossless), CSV, and raw binary formats. JLS files preserve the full 2 Msps data stream and can be reopened in the Joulescope UI for visual analysis. CSV exports are suitable for import into spreadsheet tools or custom analysis scripts. Raw binary exports provide the fastest data transfer for high-throughput automated analysis.
For advanced analysis, the captured data integrates naturally with the Python scientific computing ecosystem, NumPy for numerical computation, SciPy for signal processing and statistical analysis, Matplotlib for visualization, and Pandas for time-series data management.
Why Buy Joulescope From GSAS
GSAS provides Joulescope instruments with INR invoicing and technical support from offices in Bengaluru, Hyderabad, Chennai, Pune, Mumbai, and Delhi NCR. Our team assists with Python API integration, CI/CD pipeline setup, and measurement methodology for automated power profiling workflows.
Contact sales@gsasindia.com or call +91 80 6590 1783 to discuss your power measurement requirements.
Also appears in:
Interested in Joulescope tools?
Talk to our application engineers for personalized tool recommendations.
More from Joulescope
View all →
Battery Discharge Profiling for Coin Cell Devices: From CR2032 to 10-Year Life
5 Apr · 7 min
BLE Power Profiling: Measuring Bluetooth Low Energy Current With Joulescope
5 Apr · 7 min
Energy Harvesting and Power Measurement: Designing Self-Powered IoT Devices
5 Apr · 7 min

IoT Battery Life Testing: A Practical Methodology for Indian Product Teams
5 Apr · 7 min

Emulating Processor Power for Thermal Testing: Why Constant Power
7 Oct · 7 min

CRPS and Rack Power Supply Testing: The Six Tests That Matter
7 Oct · 7 min