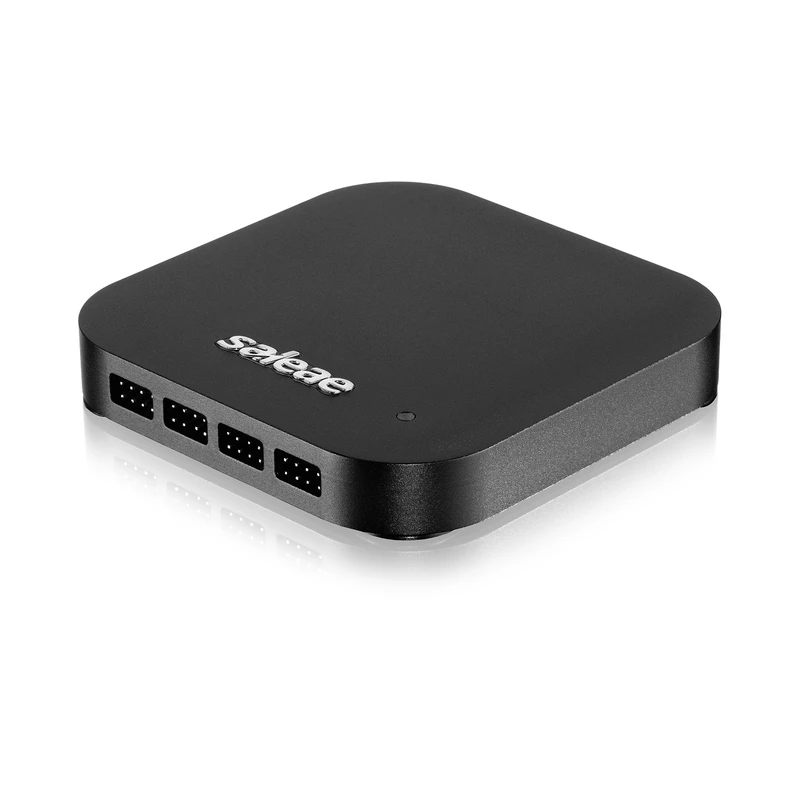
Most Indian embedded teams treat the Saleae Logic as a bench instrument, capture by hand, decode by eye, save the .sal for the bug ticket, move on. That’s how almost every one of our customers in Bengaluru and Pune uses it for the first six months. Then somebody on the test team asks the obvious question: can we just run the capture every night, automatically, and tell us when it changes?
The answer is yes, and it’s been yes since Saleae shipped the Logic 2 Automation API. This post walks through what the API is, how it works, and a concrete pattern for wiring a Saleae Logic Pro 16 (or any other Saleae device) into a nightly GitHub Actions or GitLab CI workflow on a bench Raspberry Pi.
What the Automation API is
The Logic 2 Automation API is a small, well-scoped Python library plus a gRPC service that ships with Logic 2. The Python library wraps the gRPC calls; the gRPC service itself runs inside the Logic 2 desktop application. That detail matters: Logic 2 must be running on the host for the API to work. The API is not a separate daemon, it’s a remote-control interface to the Logic 2 GUI process.
From the Python side, the working primitives are tight:
Manager.connect(), connect to a running Logic 2 instancemanager.start_capture(), start a capture with a configured device + sample-rate + durationcapture.add_analyzer(), attach a protocol analyzer (I²C, SPI, UART, CAN, etc.) to a set of channelscapture.wait(), block until the capture finishescapture.export_raw_data_csv()/capture.export_data_table_csv(), dump decoded frames to diskcapture.save_capture(), write the.salfile for later replay
That’s almost all of it. There’s no batching DSL, no test harness layer, Saleae kept the surface area small, which is exactly why it works well in CI. You assemble the workflow yourself in Python and treat the .sal and CSV outputs as the test artefacts.
Any language with a gRPC client (C#, C++, Java, JavaScript, Go, Rust) can call the same service directly, Python is the only one with an officially shipped wrapper.
A working CI pattern
Here’s the shape of a nightly HIL workflow we recommend at Indian embedded benches. The actual code is straightforward; the discipline is in the build-out.
# .github/workflows/saleae-nightly.yml
name: Saleae nightly capture
on:
  schedule:
    - cron: '0 18 * * *'   # 23:30 IST nightly
  workflow_dispatch:

jobs:
  capture:
    runs-on: [self-hosted, bench-rpi-bengaluru-01]
    steps:
      - uses: actions/checkout@v4

      - name: Bring up Logic 2 (headless via Xvfb)
        run: |
          Xvfb :99 -screen 0 1024x768x24 &
          export DISPLAY=:99
          /opt/saleae/Logic2/logic2 --automation &
          sleep 8

      - name: Run capture + decode
        run: |
          python -m pip install logic2-automation
          python tests/saleae/capture-nightly.py \
            --device "Logic Pro 16" \
            --duration 60 \
            --output build/captures/

      - name: Diff against golden
        run: |
          python tests/saleae/diff-against-golden.py \
            --candidate build/captures/i2c-bus.csv \
            --golden tests/saleae/golden/i2c-bus.csv

      - uses: actions/upload-artifact@v4
        if: always()
        with:
          name: nightly-captures
          path: build/captures/
The runs-on: [self-hosted, bench-rpi-bengaluru-01] line is the load-bearing one. The Saleae device has to be physically plugged into the runner. A bench Raspberry Pi (we use Pi 4 / 8 GB models for most teams) or a small x86 mini-PC under a desk in the lab is the standard pattern. GitHub-hosted runners can’t talk to USB hardware.
The tests/saleae/capture-nightly.py script is short:
import argparse
from saleae import automation

ap = argparse.ArgumentParser()
ap.add_argument('--device', required=True)
ap.add_argument('--duration', type=int, default=60)
ap.add_argument('--output', required=True)
args = ap.parse_args()

with automation.Manager.connect() as manager:
    device_cfg = automation.LogicDeviceConfiguration(
        enabled_digital_channels=[0, 1, 2, 3],
        digital_sample_rate=10_000_000,
    )
    capture_cfg = automation.CaptureConfiguration(
        capture_mode=automation.TimedCaptureMode(duration_seconds=args.duration),
    )
    with manager.start_capture(
        device_id=args.device,
        device_configuration=device_cfg,
        capture_configuration=capture_cfg,
    ) as capture:
        i2c = capture.add_analyzer('I2C', label='Bus0',
            settings={'SDA': 0, 'SCL': 1})
        capture.wait()
        capture.export_data_table_csv(
            filepath=f'{args.output}/i2c-bus.csv',
            analyzers=[i2c],
        )
        capture.save_capture(filepath=f'{args.output}/nightly.sal')
The diff-against-golden.py is even simpler, it compares the CSV row count and the sequence of decoded I²C addresses against a known-good baseline (the golden file you committed the first time the system worked). When the diff fails, the build fails, and the artefact upload step still runs so the failing capture is preserved for triage.
Where teams actually stumble
The technical pattern is straightforward. The places we see Indian customers lose two or three weeks are operational, not technical.
Probe placement repeatability. A capture is only as reproducible as the physical probe contact. The PCBite SQ200 hands-free probe system from Sensepeek, which Saleae sells as an accessory, is what we recommend for any bench that’s running automated captures. Flying-lead probes drift. PCBite doesn’t.
Logic 2 staying alive overnight. The headless Logic 2 process is the weak link. We run it under a systemd service with Restart=always and a watchdog that pings the gRPC port every 30 seconds. Saleae’s own CI uses the same pattern.
The golden file isn’t golden enough. First-time teams write a strict diff that fails on any byte difference, then watch the build break every morning because the system clock skewed two milliseconds and timestamps drifted. The right golden diff is on the decoded frame sequence, not the raw timing, addresses, register writes, payload values, in the order they appeared. CSV row count is a useful sanity check on top of that.
Capture file size in CI. A 60-second capture at 10 MS/s on 4 channels is a multi-megabyte .sal. Don’t commit goldens to Git; use GitHub Actions artefact storage or your team’s S3 bucket. We’ve seen one repo grow to 14 GB before someone noticed.
Why this pattern matters for Indian teams
The teams that get the most value from this workflow are the ones running long-cycle bring-up, automotive ECU programs in Pune and Chennai, sensor-hub validation in Bengaluru, medical-device protocol stacks in Hyderabad. The pattern that fails is a single engineer holding the entire Saleae knowledge in their head: when they leave, the test rack stops working. The pattern that succeeds is the Python workflow committed to the repo, the bench Pi documented in the team wiki, and the nightly capture surfacing changes before they bite during integration.
This is the workflow we walk through with every customer when they ask about automation. It’s also the reason we built our Saleae practice the way we did.
What GSAS does
GSAS engineers pair with your test team to land the first version of this workflow, typically a half-day to a day of pair programming on your actual signals, on your actual bench, in your actual repo. We hand over the Python sources and the GitHub Actions workflow; you own them. The Saleae Sample Analyzer reference repo is the starting point, but the workflow ends up specific to your bus, your decoders, and your golden definition.
If your team is sizing whether the Logic 2 Automation API solves the right problem, or if you’re choosing between Saleae and a benchtop scope plus a separate automation rig, talk to us. We sell the Logic Pro 16, Logic Pro 8, and the rest of the Saleae product line in India with this practice attached.
Also appears in:
Interested in Saleae tools?
Talk to our application engineers for personalized tool recommendations.
More from Saleae
View all →
Saleae Logic MSO: Standard or Pro? The India Buying Decision
17 Jul · 6 min
Best Logic Analyzer in India (2026): A Vendor-Neutral Buying Guide for Embedded Teams
5 Jun · 10 min
AI Data Centers in India: Test, Measurement & Memory Boom
4 Jun · 14 min
Logic Analyzer vs Oscilloscope vs MSO: When You Actually Need Analog Channels (Saleae Logic MSO)
4 Jun · 10 min

Emulating Processor Power for Thermal Testing: Why Constant Power
7 Oct · 7 min

CRPS and Rack Power Supply Testing: The Six Tests That Matter
7 Oct · 7 min