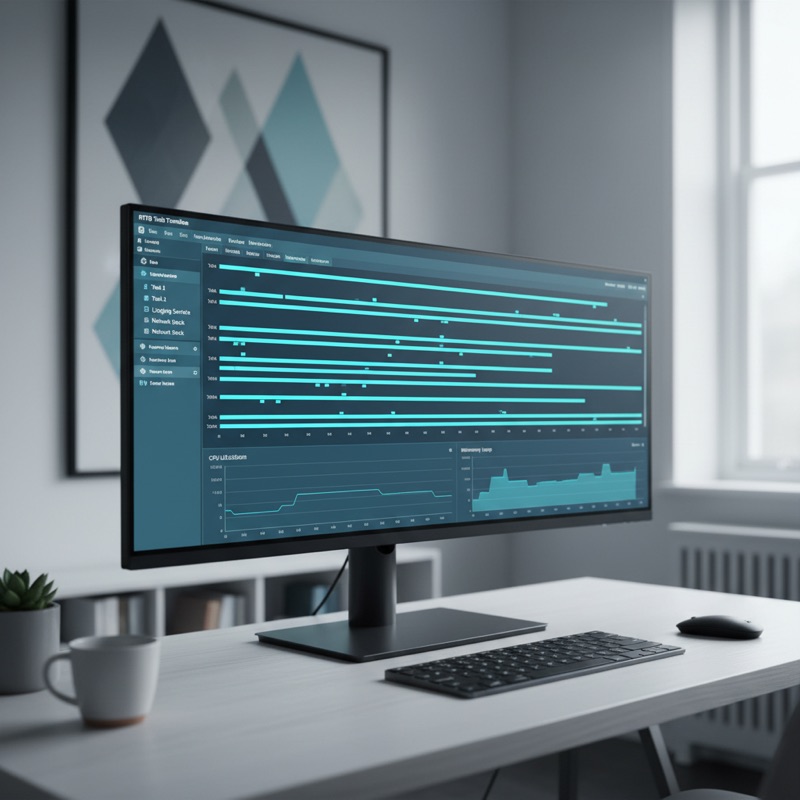
When an RTOS-based embedded system misbehaves, missed deadlines, unexpected latency, priority inversions, or intermittent jitter, the root cause is almost always a scheduling or timing issue that is invisible to a traditional debugger. Halting the target to inspect state destroys the very timing relationships you need to observe. SEGGER SystemView addresses this by recording RTOS events in real time and presenting them as a timeline, giving developers a precise picture of when each task runs, how long it takes, and what interrupts it.
What SystemView Records
SystemView captures four categories of events on a unified timeline:
Task events: task creation, start, stop, ready, suspend, resume, and termination. Each task gets a distinct color on the timeline, making it immediately visible when a task runs, how long it executes, and when it yields or blocks.
ISR events: interrupt entry and exit with precise timestamps. SystemView shows ISR nesting depth, duration, and the CPU time consumed by each interrupt source. This is essential for verifying that ISR execution time stays within budget and that interrupt priorities are configured correctly.
Custom application events: user-defined markers that instrument specific points in application code. Use these to mark the start and end of a critical algorithm, a sensor read, a network packet transmission, or any application-specific event that matters for timing analysis.
System information: CPU load (total and per-task), context switch duration, and stack usage high watermarks. SystemView calculates these statistics from the raw event stream and displays them as both real-time values and aggregated summaries.
Supported RTOS
SystemView integrates with multiple real-time operating systems through instrumentation libraries that hook into the RTOS kernel’s scheduling events:
embOS: Zero-configuration native integration. embOS includes SystemView instrumentation in the kernel source code. Enable recording and events flow to SystemView automatically. No additional porting or configuration required.
FreeRTOS: SEGGER provides a FreeRTOS trace hook implementation that maps FreeRTOS scheduler events to SystemView events. Adding SystemView to a FreeRTOS project involves including the SEGGER RTT and SystemView source files, adding the trace hook macros to FreeRTOSConfig.h, and calling SEGGER_SYSVIEW_Conf() at startup.
ThreadX (Azure RTOS): SystemView supports ThreadX through a trace hook module. The setup follows the same pattern: include SystemView source files, register the trace callbacks with the ThreadX kernel, and initialize SystemView before starting the scheduler.
Micrium OS: Supported through Micrium’s trace hook interface.
Bare-metal: SystemView can record ISR events and custom application events without an RTOS. This is useful for profiling interrupt-driven bare-metal systems where task scheduling is not present but ISR timing and event sequencing still matter.
Setup Workflow
Setting up SystemView involves three steps:
1. Add SystemView to Your Project
Include the SEGGER SystemView source files (SEGGER_SYSVIEW.c, SEGGER_SYSVIEW_Config_*.c) and the RTT source files (SEGGER_RTT.c, SEGGER_RTT_printf.c) in your project. These files are included in the J-Link Software and Documentation Pack, downloadable from SEGGER’s website.
2. Configure the RTOS Integration
For embOS, no additional configuration is needed, the kernel instruments itself.
For FreeRTOS, add the following to FreeRTOSConfig.h:
#include "SEGGER_SYSVIEW_FreeRTOS.h"
#define INCLUDE_xTaskGetIdleTaskHandle  1
#define INCLUDE_pxTaskGetStackStart     1
Then call SEGGER_SYSVIEW_Conf() in your main function before vTaskStartScheduler().
3. Start Recording
Connect a J-Link probe to the target. Open the SystemView application on the host PC. Click Start Recording. SystemView locates the RTT control block in target RAM, begins streaming events through the J-Link’s background memory access, and displays the timeline in real time.
Alternatively, use post-mortem mode: SystemView records events to a circular buffer in target RAM. After a crash or anomaly, read the buffer contents through the debugger. This is useful for capturing events leading up to a failure without requiring a continuous host connection.
Analysis Techniques
Identifying Missed Deadlines
Sort the timeline by task and examine execution duration. If a task’s worst-case execution time exceeds its period, deadlines will be missed. SystemView’s statistics view shows min, max, and average execution time per task, look for tasks where the max significantly exceeds the average, indicating sporadic timing spikes.
Finding Priority Inversions
A priority inversion occurs when a high-priority task blocks on a resource held by a lower-priority task, while a medium-priority task preempts the low-priority holder. On the SystemView timeline, this appears as a high-priority task in the blocked state while a medium-priority task runs. The visual pattern is distinctive, look for a high-priority task’s colored bar interrupted by a medium-priority task that should not be able to preempt it.
Measuring ISR Impact
The ISR timeline shows exactly how much CPU time interrupts consume and how they interact with task scheduling. High-frequency interrupts that preempt time-critical tasks are a common source of jitter. SystemView quantifies this: filter the timeline to show only ISR events and check the cumulative CPU load percentage.
Verifying CPU Load Budget
SystemView displays real-time CPU load as a percentage. For deterministic embedded systems, the total CPU load should remain well below the schedulability bound for your scheduling algorithm. If CPU load approaches or exceeds the bound, the system is at risk of missed deadlines under worst-case conditions.
Custom Event Instrumentation
Add SEGGER_SYSVIEW_RecordU32() or SEGGER_SYSVIEW_RecordString() calls at strategic points in your application code to correlate application-level events with RTOS scheduling decisions. For example, mark the start and end of a motor control computation to measure its duration and see exactly which tasks and ISRs preempt it.
#include "SEGGER_SYSVIEW.h"

#define MY_APP_EVENT_MOTOR_CTRL_START  (512u)
#define MY_APP_EVENT_MOTOR_CTRL_END    (513u)

void motor_control_loop(void) {
    SEGGER_SYSVIEW_RecordU32(MY_APP_EVENT_MOTOR_CTRL_START, current_rpm);
    compute_pid();
    update_pwm();
    SEGGER_SYSVIEW_RecordU32(MY_APP_EVENT_MOTOR_CTRL_END, output_duty);
}
These custom events appear on the SystemView timeline alongside task and ISR events, providing full context for timing analysis.
Hardware Requirements
SystemView uses RTT as its data transport, so it works with any J-Link model. Higher-end models like the ULTRA and PRO provide faster background access rates, which improves the maximum sustainable event throughput. For systems with high event rates (many tasks, high-frequency ISRs), a faster J-Link reduces the risk of dropped events.
The SystemView host application is free. It is included in the J-Link Software and Documentation Pack for Windows, macOS, and Linux.
SystemView in India from GSAS
GSAS provides SystemView, J-Link probes, and embOS with local stock, INR invoicing, and application engineering support from offices in Bengaluru, Chennai, Hyderabad, Delhi NCR, Mumbai, and Pune. For teams evaluating SystemView for RTOS profiling, GSAS can provide J-Link evaluation units and embOS trial licenses.
Explore SystemView | View all SEGGER products | Request a quote
Also appears in:
Interested in SEGGER tools?
Talk to our application engineers for personalized tool recommendations.
More from SEGGER
View all →
Meet the GSAS Team at electronica India 2026, Stall H3.I45
15 Sept · 3 min
J-Link Is Now Validated by ST for StellarStudio
13 Sept · 2 min

An AI Agent That Drives the Debugger: SEGGER and Embedder Connect J-Link to the Loop
13 Sept · 6 min
SEGGER J-Link and J-Trace Now Support Andes Trace: Why This Matters for RISC-V
21 Jul · 6 min

Emulating Processor Power for Thermal Testing: Why Constant Power
7 Oct · 7 min

CRPS and Rack Power Supply Testing: The Six Tests That Matter
7 Oct · 7 min