In short
Validating 802.1AS means proving a bounded time error, not reporting a locked state. Avnu defines Time Error as the difference between time measured at the device under test and time reported at a reference at the same instant, sampled over an observation window whose Maximum Time Error is the headline statistic. Measure it at the pin by comparing a 1PPS derived from the device against one derived from the grandmaster, cross-check it against what the PTP daemon reports, and repeat the whole measurement during grandmaster failover, under injected path asymmetry and under network load. A bare microsecond figure with no method, window or topology attached is not evidence.
A time synchronisation test report says gPTP is locked on all nodes, with a screenshot of a daemon log and a small offset in it. That proves a servo has an opinion about itself. It does not say how far the recovered clock sits from the grandmaster, over what interval, with what in the path, or what happens when the grandmaster is pulled out.
This article is about the number you report. It is not about why the domain will not form: our gPTP troubleshooting guide owns that, and everything below assumes the domain already works.
What proving time sync means, as opposed to seeing it lock
Locked is a state, bounded time error is a measurement
In linuxptp, “locked” is a digit in a log line. The servo state enum runs SERVO_UNLOCKED, SERVO_JUMP, SERVO_LOCKED, SERVO_LOCKED_STABLE, so s2 means the servo believes it is tracking, computed from the same timestamps the servo is steering with: self-assessment, not measurement.
Avnu’s testability work defines the measurement instead. Its 802.1AS Recovered Clock Quality Testing document, revision 1.0 dated 18 October 2016, states the objective as measuring recovered clock quality “by measurement of the Time Error, which is defined as the difference between time measured at the device under test and a reference, at the same instant”:
Time Error = Time (measured on DUT) - Time (reported at reference)Two clocks are never perfectly synchronised, so what matters is a set of derived measurements “based on sampling the Time Error over a period of time called an Observation Window”, of which “the most important of these is the Maximum Time error, which is the maximum absolute value of the Time Error over that interval”. A report missing any of those terms is not reporting a bound.
That document is written against 802.1AS-2011 and against what was then a draft of the 1588 slave event monitoring work. That work was standardised in IEEE 1588-2019 and gPTP was revised as 802.1AS-2020, so check clause numbers against the current standard. The Time Error definition, the three methods and the observation window statistic are unaffected.
The three questions an auditor asks
How accurate, against what. A number with no reference named is not a measurement. Avnu’s lab framing is a device connected directly to a grandmaster with a comparable output.
Under what conditions. A figure from an idle two-node bench is a different claim from one captured on a loaded network after two hours.
What happens on failure. The grandmaster going away, a second candidate appearing, a link filling with scheduled traffic. These rarely appear in a supplier’s evidence.
The quantities you actually measure
Time error between the device under test and the reference, at the pin
Measuring at the pin means comparing a physical signal from the device’s recovered clock against one from the reference, so the comparison happens outside both software stacks.
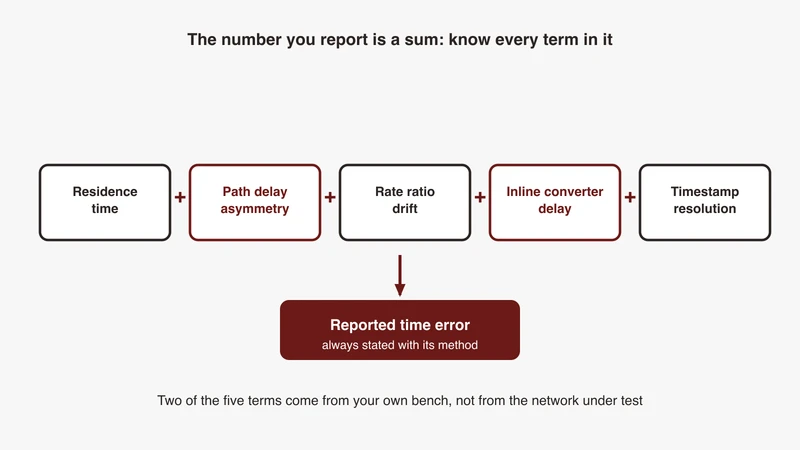
Residence time through each bridge
Every time-aware bridge holds a Sync message and must account for it. Avnu imposes this on integrated devices in the Reverse Sync path: a bridge forwarding a Reverse Sync or Follow_Up out of the slave port adjusts its correction field “for the residence time of the Sync Message”, and “shall track the residence time in the timebase of the domain that’s being measured”. One that forwards without accounting is invisible from either endpoint.
Path delay asymmetry, and why it is the silent error source
Peer delay measures the round trip to the immediate neighbour, subtracts the neighbour’s turnaround time, and takes the mean of what is left as the delay in each direction. Where the two directions are not in fact equal the error is constant, survives every servo state, and makes the reported offset look excellent while the real time error sits at a fixed bias. linuxptp exposes corrections for a characterised path: delayAsymmetry is “the time difference in nanoseconds of the transmit and receive paths”, positive when the server-to-client propagation time is longer, and ingressLatency and egressLatency correct hardware delay at each end. They correct delays you measured, not ones you did not.
Neighbour rate ratio drift over temperature and runtime
Between synchronisation points the recovered clock runs on its own oscillator scaled by an estimated rate ratio, so error in that ratio integrates. Avnu: “Some of the most common components of the synchronization error come from improper syntonization (frequency locking)”, and “the error accumulates as time passes between two successive synchronization points.” Hence when you sample matters.
Quantity, bound, measurement point, instrument category
| Quantity | What it bounds | Where measured | Instrument category |
|---|---|---|---|
| Time error | Agreement between device clock and reference | Physical output of both | Time-interval instrument |
| Maximum time error over a window | Worst case the time base’s consumer sees | Same, as a statistic | Same, plus analysis |
| Residence time | Error a bridge adds and fails to correct | Bridge ingress and egress | Capture on both ports, hardware timestamped |
| Path delay asymmetry | Constant bias in every offset on that link | With and without the element | Same instrument, mean not spread |
| Rate ratio drift | Error accumulated between sync points | Across the sync interval | Time-interval instrument, non-aliasing sampling |
| Timestamp resolution | Floor below which no claim holds | Device and instrument specs | Read from datasheets |
Method 1: measure at the pin with 1PPS
Deriving a comparable pulse from the grandmaster and the device under test
Avnu describes the traditional method as “the use of a physical 1PPS line”, comparing “the rise time of a signal transmitted at the edge of each new second on the Slave clock to the rise times of the same signal on the reference clock”, the device connected directly to a grandmaster with a similar output.
The obstacle is the pulse: in the automotive environment “ECUs have limited size and resources, and a separate output pin for 1PPS is often considered too costly”. Where the recovered clock is a Linux PTP hardware clock, the kernel’s PHC infrastructure lists “Period output signals configurable from user space” among the ancillary features a driver may support. Whether yours does is a datasheet question.
Avnu also records the limit that makes this method insufficient alone: “The internal clock of the Slave might have a static offset that is canceled out by an opposite static offset in the logic that drives the 1PPS output, and this error condition is not observable when only the 1PPS measurement method is used.”
Scope, counter or time-interval analyser, and the trigger discipline
Three instrument categories take this measurement: an oscilloscope, which shows the edges and their noise, so you see that your “pulse” has a slow rise and an ambiguous crossing; a time-interval counter, which gives the interval directly and accumulates a long series; and a time-interval analyser, built for this statistic over long runs.
The discipline is the same in all three: trigger both channels on the same threshold and edge polarity, with matched impedance and coupling, and record those settings. A trigger level landing at different points on two differently shaped edges produces a systematic offset that looks like a time error and is yours.
Cable and probe delay budget: subtract it or report it
Differences matter here, not totals: the two cables and their length difference, the two probes or input paths and their propagation difference, the instrument’s channel-to-channel skew, its single-shot resolution, and the edge rate of each pulse against the trigger threshold, which sets how much amplitude noise becomes timing noise.
Either subtract that budget, by feeding one source into both channels through the intended cabling and recording the residual as your zero, or report it as the floor beneath which the measurement means nothing. Omitting it publishes a measurement of the bench as a measurement of the product.
Running the measurement long enough to see drift
An instantaneous offset is not a bound. Temperature moves oscillators and rate ratio error integrates, so a capture short enough to miss both reports a number the product cannot hold. The window must be long enough that the statistic is stable across repeats. Avnu’s default certification requirement uses five minutes; a vehicle programme’s may be longer, and the requirement decides.
Method 2: measure in software and know its limits
What a PTP daemon reports, and what it cannot see
ptp4l’s periodic line carries an offset, a servo state digit, a frequency correction and a path delay. With summary_interval set it prints statistics instead: “offset root mean square (RMS), maximum absolute offset, frequency offset mean and standard deviation, and path delay mean and standard deviation”, in nanoseconds and parts per billion. Maximum absolute offset over a summary interval has the same shape as Avnu’s maximum time error over an observation window. The difference is whose opinion it is.
Avnu states the limit precisely for its Ingress Reporting method: whether the device reports raw values or a computed offsetFromMaster, “the Time Error is the Slave’s perception of the Time Error”, the tester “just acting as a collecting agent for samples provided by the Slave”. And: “Time Error in the interval between Sync messages is not observable.”
Both apply to a daemon log. An error common to the servo’s inputs and to the reported offset, which is exactly what an uncorrected path asymmetry is, cancels in the report and persists in reality.
Hardware timestamping versus software timestamping
A software timestamp is taken after the operating system has added its own scheduling delay to the path you are measuring, and that delay is neither constant nor small at the scale 802.1AS works at. Hardware timestamping moves the stamp to where the frame crosses the interface. Confirm which you are getting: ethtool -T shows the timestamping capabilities and the associated PTP hardware clock, and you want hardware-transmit, hardware-receive and hardware-raw-clock, an index rather than none on the PTP Hardware Clock line, and a receive filter mode covering layer 2 PTP. One caution from our scheduling and sync article: a schedule can hold a frame for up to a cycle, and that delay lands inside a software timestamped number.
Cross-checking a software number against the pin measurement
Avnu does not require both methods, but it does say what has to hold if you run both. A device must either have a 1PPS output associated with the measured gPTP domain or implement the Reverse Sync and Ingress reporting methods, and “if more than one measurement method is used, the measured clock quality must be met by all measurement methods.”
Adopt it as bench practice. Run both over the same window on the same setup. Agreement gives two independent views of one quantity, so the cheaper one can then carry regression runs. Disagreement is the finding, and the two notes above are the first hypotheses.
The Avnu recovered clock quality methodology, adapted to a lab bench
What the methodology specifies
The document defines methodologies for validating gPTP recovered clock quality, for certification and for lab and field testing. It names three: 1PPS, an Ingress Reporting method built on the IEEE 1588 slave event monitoring draft, and a Reverse Sync method.
Reverse Sync is worth understanding even if you never certify. The device outputs its recovered clock back onto the network as Sync and Follow_Up messages on a separate PTP domain, so a tester measures that clock through ordinary gPTP message handling rather than a pin. Three control points are specified: reverseSyncEnabled, default FALSE; reverseSyncDomain, which for certification should differ from the measured domain; and reverseSyncRate, a percentage of the incoming rate.
The rate rule is usable immediately. Because syntonization error accumulates between synchronisation points, “if the Reverse Sync messages would always be sent immediately after a synchronization point (after adjusting the clock offset), such errors would be hidden from the measurement.” The fix is to sample at varying points inside the sync interval, either faster than the incoming rate, with two times Nyquist given as an example at 31.25 ms for 8 pps in, or at a rate that is not an integer multiple of it. The default is 95 percent of the incoming Sync rate, or of 8 pps if unknown, which “allows sampling at all points of the Sync interval within 20 samples, or for a rate of 8 pps, within 2.5 seconds.”
The default certification requirement is that, unless an Avnu certification development subgroup specifies otherwise for an industry, “the Slave clock shall synchronize within 6 seconds to within +-80ns of the directly connected Master and shall maintain this clock quality over a 5 minute observation window”, with subgroups free to define different lock time, lock quality, observation interval and holdover behaviour. The linuxptp documentation carries no hop budget; the Avnu testability document does, and it derives it from the gPTP design goal that any two time-aware systems separated by seven or fewer hops “will be synchronized to within 1 μs peak-to-peak of each other during steady-state operation”.
A bench procedure derived from it
What follows is this article’s derivation for a lab bench. It is not an Avnu procedure and not a certification test. Avnu specifies the quantity, the statistic and the sampling principle; the sequencing is ours.
- Fix and draw the topology. Two nodes directly connected for the baseline; every additional element goes in later, one at a time, and gets drawn.
- Record the configuration on both ends: transport, delay mechanism, sync interval, any latency or asymmetry corrections, and the timestamping mode confirmed rather than assumed.
- Characterise the instrument by feeding one source into both channels through the intended cabling and recording the residual. That is your floor.
- Warm up, letting the domain establish and temperature settle, and record the warm-up time; it is part of the method.
- Capture over a stated observation window, sampling so you do not land at a fixed phase within the sync interval.
- Report statistics over that window: maximum absolute time error, mean, a dispersion measure, window length and instrument floor.
- Repeat, then add one element at a time and repeat again. A statistic that moves between runs of equal length says the window is too short; a change on adding an element is that element’s contribution.
Reporting: state the method with every number
A time error figure without a method is not falsifiable. Every number carries its method, reference, observation window, topology and instrument floor, and where it derives from a published methodology, say which and what you changed.
Negative testing, where most designs actually fail
Each case below is a procedure with observables. None carries a pass threshold from us: that belongs to the requirement consuming the time base, which is why Avnu states a default, 6 seconds to within +-80 ns of a directly connected master held over a 5 minute observation window, and then lets certification development subgroups addressing specific industries define a different lock time, lock quality, observation interval and holdover behaviour.
Grandmaster failover
Keep the measurement running, then remove the grandmaster. Observables: when the source stops, the peak excursion during holdover, when a new source is selected, whether recovery is a step or a slew, and the settling afterwards. The transient is the point; reporting the end state alone misses it.
Two candidate masters, or a rogue announce
Introduce a second candidate and observe which is selected and how long selection takes. On a bench running the automotive profile configuration this is a configuration test as much as a protocol test: those configs disable the selection algorithm and inhibit announce messages, so the correct behaviour is that the intruder changes nothing. That covers Announce. It does not cover Sync: automotive-slave.cfg also sets ignore_source_id 1, so the client accepts Sync and Follow_Up from any source on the domain. Inject Sync from a second source, not only Announce, before calling the configuration safe, and watch the measured time error while you do it.
Malformed and out-of-spec messages
Inject messages wrong in single, specific ways: a wrong domain, a wrong transport-specific value, a sync interval far outside expectation, a truncated message. The observable is that the stack ignores them and the measured time error does not move. A port that goes faulty is a robustness finding.
Deliberate asymmetry injection
Add a known, characterised asymmetry to one direction and check the measured mean time error moves by the predicted amount in the predicted direction. This validates the whole measurement chain, being the only test where you know the answer in advance. The predicted amount is half the injected asymmetry: peer delay returns the mean of the two directions, so lengthening one direction by X nanoseconds moves the mean time error by X/2.
Sync under queue load
Load the path and repeat. Where the load is a time-aware schedule rather than best-effort traffic, our scheduling article owns the interaction, including the point that a periodic delay aliases against a periodic sample rate and produces a slow wander unrelated to the oscillator.
Instrument-induced error: taps, converters and switches in your own setup
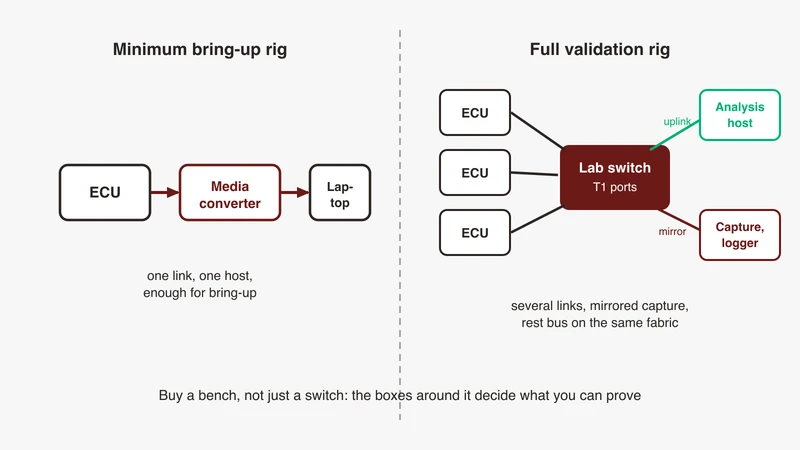
Inline media converters add delay the domain does not correct
A transparent media converter is not a time-aware bridge. It neither measures nor corrects the time a frame spends inside it, so any difference between its ingress and egress paths becomes a fixed bias. The criterion from our converter selection guide applies unchanged: the question is not what the latency is, it is whether the latency is fixed and whether the two directions are equal. Fixed and characterised, correct it with delayAsymmetry and say so in the report. Otherwise it is an uncontrolled variable in your evidence, as is whatever you used to observe the traffic: our capture methods guide covers tap against mirror port against converter, and asymmetry belongs in that choice.
Non-transparent switches in the test path invalidate the result
A bridge that forwards gPTP unchanged, adding queueing delay nothing in the domain accounts for, is worse than one that drops it: the domain forms and is quietly wrong. Any switch in the measurement path either participates as a time-aware device or is absent. “It is only a lab switch” is not a mitigation, it is an unmeasured hop.
Documenting the test topology as part of the evidence
The topology is part of the number, not context for it. For every element between the grandmaster and the device under test, say whether it participates in the domain, whether its delay is characterised, and whether its two directions are equal. Without that list a reviewer is asked to take the result on faith.
Writing the time sync test report
Minimum contents
Topology, drawn, with each element’s participation status. Method, named, with the methodology it derives from and what changed. Configuration of both ends, timestamping mode confirmed. Warm-up and window in seconds. Statistics over the window, maximum absolute time error as the headline with a dispersion measure beside it. Instrument floor, characterised. Negative cases, each with what was done and observed. Deviations, listed rather than smoothed over.
How this evidence feeds conformance and interoperability work
Conformance testing asks whether a device behaves as the specification says; interoperability testing asks whether two devices that each pass conformance work together. Neither answers this article’s question, which is how much time error the deployed combination produces in your topology. This evidence feeds those programmes rather than replacing them.
Where GSAS fits
Most time sync work we are asked into starts with a number somebody does not trust. A supplier reported a time error, the integration team cannot reproduce it, and nobody wrote down the topology or the window. The useful first conversation is a review of that setup for method error, because a bench with an uncharacterised instrument floor, an unaccounted converter or a sample rate locked to the sync interval produces a stable, repeatable, wrong number indefinitely.
The second is about instrumentation. Pin-level and capture-level measurement answer different questions, have different floors, and the right split depends on whether your devices can expose a pulse at all. We help teams decide which measurements their programme needs, what each instrument category can and cannot bound, and how to write evidence that survives an audit. GSAS is an engineering partner, and our applications engineers work with teams in Bengaluru, Pune, Chennai and Hyderabad.
If you are being asked to prove 802.1AS works and are not confident the current evidence would survive a challenge, our automotive Ethernet capabilities page covers how we engage, and you can request a consultation to talk it through with an applications engineer.
References
- Avnu Alliance, 802.1AS Recovered Clock Quality Testing, Revision 1.0, 18 October 2016, approved for public release: https://avnu.org/wp-content/uploads/2014/05/Avnu-Testability-802.1AS-Recovered-Clock-Quality-Measurement-1.0_Approved-for-Public-Release.pdf
- Avnu Alliance, certification and test plan context: https://avnu.org/
- IEEE 802.1 Time-Sensitive Networking Task Group: https://1.ieee802.org/tsn/
- Linux kernel documentation, PTP hardware clock infrastructure: https://docs.kernel.org/driver-api/ptp.html
- linuxptp project, ptp4l manual page, for delayAsymmetry, ingressLatency, egressLatency and summary_interval statistics: https://linuxptp.nwtime.org/documentation/ptp4l/
- linuxptp source, servo state enum and the gPTP and automotive example configurations: https://github.com/richardcochran/linuxptp
- OPEN Alliance specification register: https://opensig.org/
Also appears in:
Building for Automotive & Mobility?
Talk to our application engineers for personalized tool recommendations.