Why Automate Oscilloscope Measurements?
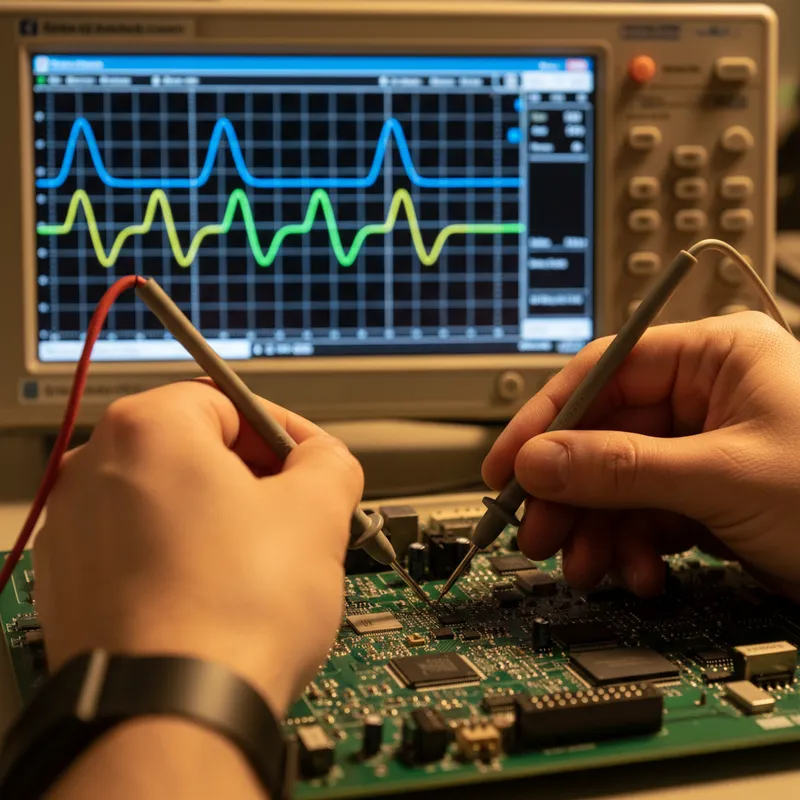
Manual oscilloscope operation, adjust settings, capture, read values, record in a spreadsheet, works for bench debugging. But for production testing, design characterization, and data acquisition, manual operation is too slow and introduces operator variability.
Pico Technology’s pyPicoSDK is a Python package that provides programmatic control of PicoScope oscilloscopes. Combined with Python’s NumPy, SciPy, and matplotlib ecosystem, it enables engineers to build automated measurement scripts that run unattended, produce consistent results, and integrate with existing data pipelines.
Prerequisites
Hardware
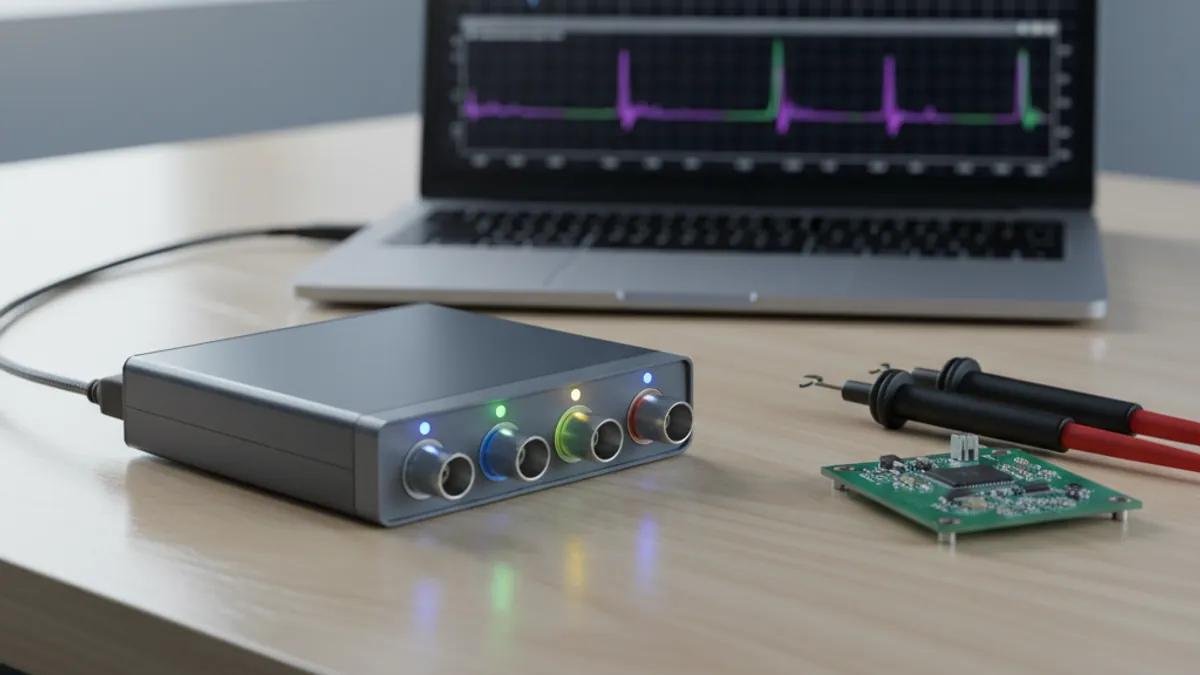
Any PicoScope supported by PicoSDK, this includes the PicoScope 2000, 3000, 4000, 5000, and 6000E series. Connect the PicoScope to your PC via USB.
Software
- PicoSDK: install from picotech.com/downloads. This installs the device drivers and shared libraries.
- Python 3.8+: standard Python installation
- pyPicoSDK: install via pip:
pip install pyPicoSDKpyPicoSDK depends on NumPy, which is installed automatically.
Tutorial: Basic Voltage Measurement
Step 1: Connect and Open the Device
from pyPicoSDK import ps3000a  # Import the driver for your PicoScope model

## Open the first available PicoScope 3000A series device
scope = ps3000a.open_unit()
print(f"Connected to: {scope.info}")
The open_unit() function scans USB for connected PicoScope devices and returns a handle to the first one found. If you have multiple scopes connected, you can specify the serial number.
Step 2: Configure a Channel
## Configure Channel A
scope.set_channel(
    channel='A',
    enabled=True,
    coupling='DC',
    range_mv=5000,  # +/- 5V range
    offset_mv=0
)

## Disable unused channels to maximize sample rate
scope.set_channel(channel='B', enabled=False)
scope.set_channel(channel='C', enabled=False)
scope.set_channel(channel='D', enabled=False)
The range_mv parameter sets the input voltage range. Choose the smallest range that accommodates your signal, this maximizes ADC resolution.
Step 3: Configure Timebase and Capture
import numpy as np

## Set the sample interval and number of samples
sample_interval_ns = 100  # 100 ns between samples = 10 MS/s
num_samples = 10000       # 10,000 samples = 1 ms capture window

## Configure the timebase
scope.set_timebase(sample_interval_ns=sample_interval_ns, num_samples=num_samples)

## Set a simple trigger: rising edge on Channel A at 1V
scope.set_trigger(
    channel='A',
    threshold_mv=1000,
    direction='RISING',
    auto_trigger_ms=5000  # Auto-trigger after 5 seconds if no event
)

## Run a single capture
scope.run_block()

## Wait for the capture to complete
scope.wait_ready()
Step 4: Retrieve and Process Data
## Get the captured data as NumPy arrays
time_ns, voltage_mv = scope.get_data(channel='A')

## Convert to standard units
time_us = time_ns / 1000.0
voltage_v = voltage_mv / 1000.0

## Calculate basic statistics
v_mean = np.mean(voltage_v)
v_rms = np.sqrt(np.mean(voltage_v ** 2))
v_peak = np.max(voltage_v) - np.min(voltage_v)

print(f"Mean: {v_mean:.3f} V")
print(f"RMS:  {v_rms:.3f} V")
print(f"Peak-to-peak: {v_peak:.3f} V")
Step 5: Save and Close
## Save data to CSV
np.savetxt('measurement.csv',
           np.column_stack([time_us, voltage_v]),
           delimiter=',',
           header='Time_us, Voltage_V',
           comments='')

## Close the PicoScope connection
scope.close()
Production Test Application
For production testing, verifying that a power supply output meets specifications across a batch of units, the script expands to:
def test_power_supply(scope, unit_id):
    """Test a power supply unit and return pass/fail results."""
    scope.run_block()
    scope.wait_ready()
    time_ns, voltage_mv = scope.get_data(channel='A')
    voltage_v = voltage_mv / 1000.0

    v_mean = np.mean(voltage_v)
    v_ripple = np.max(voltage_v) - np.min(voltage_v)

    # Define pass/fail criteria
    results = {
        'unit_id': unit_id,
        'v_mean': v_mean,
        'v_ripple': v_ripple,
        'mean_pass': 4.95 <= v_mean <= 5.05,  # 5V +/- 1%
        'ripple_pass': v_ripple < 0.050,       # < 50 mV ripple
    }
    results['overall_pass'] = results['mean_pass'] and results['ripple_pass']
    return results
Call this function for each unit in the batch, collect results, and export a test report.
Data Acquisition Application
For long-duration data logging, monitoring a temperature sensor output over hours, use streaming mode:
## Streaming mode captures data continuously
scope.run_streaming(
    sample_interval_ns=1000000,  # 1 ms sample interval = 1 kS/s
    buffer_size=100000            # 100k sample buffer
)

## Process data in real-time using a callback
import time
all_data = []

for i in range(3600):  # Capture for 1 hour
    time.sleep(1)
    data = scope.get_streaming_data(channel='A')
    if data is not None:
        all_data.append(data)
Integration with Analysis Libraries
pyPicoSDK returns NumPy arrays, making integration simple with:
- SciPy: Signal processing (filtering, FFT, peak detection)
- matplotlib: Waveform and spectrum visualization
- pandas: Data organization and export
- scikit-learn: Statistical analysis and anomaly detection for production test data
Why Buy PicoScope from GSAS
GSAS Micro Systems is an authorized Pico Technology partner. Our engineers support pyPicoSDK integration for automated test systems, from script development guidance to full test station architecture.
- PicoSDK and pyPicoSDK setup assistance
- Demo units at offices in Bengaluru, Hyderabad, Chennai, Pune, Mumbai, and Delhi NCR
- INR invoicing with GST-compliant documentation
- Application engineering for automated test system design
Also appears in:
Interested in Pico Technology tools?
Talk to our application engineers for personalized tool recommendations.
More from Pico Technology
View all →
How to Buy an Oscilloscope in India (2026): USB vs Benchtop, Bit Depth, Bandwidth: A Buying Guide
5 Jun · 11 min
PicoScope 5000D vs 5000E: Native 16-Bit or FlexRes? A Buyer's Guide for Indian Labs
4 Jun · 11 min
PicoScope 5000E in India: The World's First 4-Channel 16-Bit USB Oscilloscope, Explained
4 Jun · 11 min
PicoScope 7 Goes Native Arm64: Apple Silicon, Snapdragon Windows and Arm Linux Test Benches in India
4 Jun · 11 min

Emulating Processor Power for Thermal Testing: Why Constant Power
7 Oct · 7 min

CRPS and Rack Power Supply Testing: The Six Tests That Matter
7 Oct · 7 min